


seaborn之displot-直方图和密度图的集合体


对于数据频度和密度的表示
通常可以用频度图和密度图进行
在matplotlib有hist 方法
x = np.random.randn(100)
plt.hist(x)
plt.show()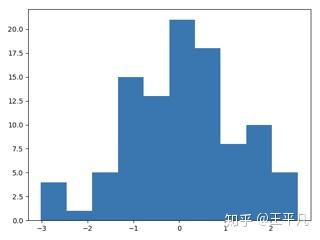
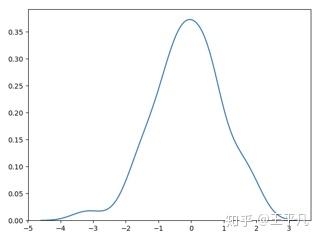
Seaborn 的 kdeplot 可以用于画出密度图
sns.kdeplot(x)
plt.show()
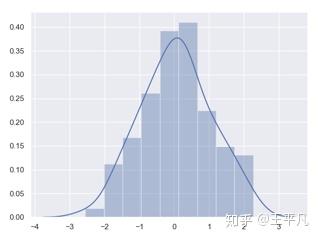
在实际应用中个,我们通常将两个图 结合 起来看,这样 同时 观察数据的 趋势和分布
seaborn的 distplot 可以一键完成这个操作。
我们先来看 displot函数
seaborn.distplot(a, bins=None, hist=True, kde=True, rug=False,
fit=None, hist_kws=None, kde_kws=None, rug_kws=None, fit_kws=None,
color=None, vertical=False, norm_hist=False, axlabel=None,
label=None, ax=None)
2 .1话不多说,我们通过第一个例子熟悉一下displot方法,其中参数 a 是必须要填的,格式可以为pandas 的series或者 list。
sns.set(); np.random.seed(0)
x = np.random.randn(100)
ax = sns.distplot(x)
plt.show()
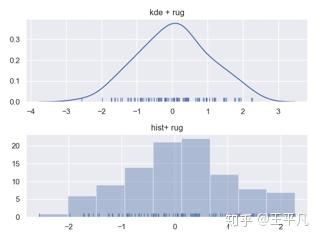
2.2 通过修改 hist, kde, rug 控制一种或者几种方式的输出, rugplot (用等长线段和密集方法表示聚集程度)
话不多说,我们通过第一个例子熟悉一下 displot方法,默认是kde和hist的组合 ,即密度图和直方图
fig = plt.figure()
ax1 = fig.add_subplot(2,1,1)
ax2 = fig.add_subplot(2,1,2)
ax1.set_title("kde + rug")
ax2.set_title("hist+ rug")
sns.distplot(x, rug=True, hist= False, ax = ax1)
sns.distplot(x, kde= False, rug= True, ax = ax2)
plt.show()
2.3 通过修改 fit 属性进行分布的修改,前提要把kde设置为False,表明不启用。fit默认是None, 可选有很多,可以参照以下链接
from scipy.stats import norm, laplace, kappa3,vonmises
fig = plt.figure()
ax1 = fig.add_subplot(2,2,1)
ax2 = fig.add_subplot(2,2,2)
ax3 = fig.add_subplot(2,2,3)
ax4 = fig.add_subplot(2,2,4)
ax1.set_title('norm')
ax2.set_title('laplace')
ax3.set_title('kappa3')
ax4.set_title('vonmises')
ax = sns.distplot(x, fit=norm, kde=False, ax = ax1)
ax = sns.distplot(x, fit=laplace, kde=False, ax=ax2)
ax = sns.distplot(x, fit=kappa3, kde=False, ax = ax3)
ax = sns.distplot(x, fit=vonmises, kde=False, ax = ax4)
plt.show()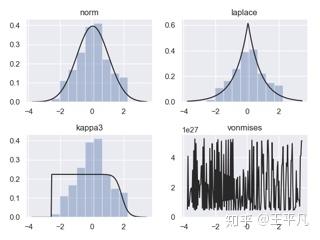
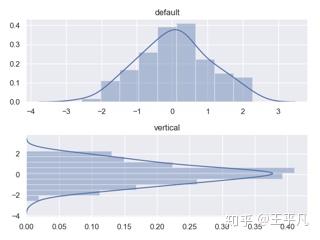
2.4 调整横向,纵向显示, 通过设置vertical属性,默认为False
fig = plt.figure()
ax1 = fig.add_subplot(2,1,1)
ax2 = fig.add_subplot(2,1,2)
ax1.set_title("default")
ax2.set_title("vertical")
ax = sns.distplot(x, ax= ax1)
ax = sns.distplot(x, vertical=True, ax=ax2)
plt.show()
2.5 改变颜色 color
fig = plt.figure()
ax1 = fig.add_subplot(2,1,1)
ax2 = fig.add_subplot(2,1,2)
ax1.set_title("default")
ax2.set_title("red")
ax = sns.distplot(x, ax= ax1)