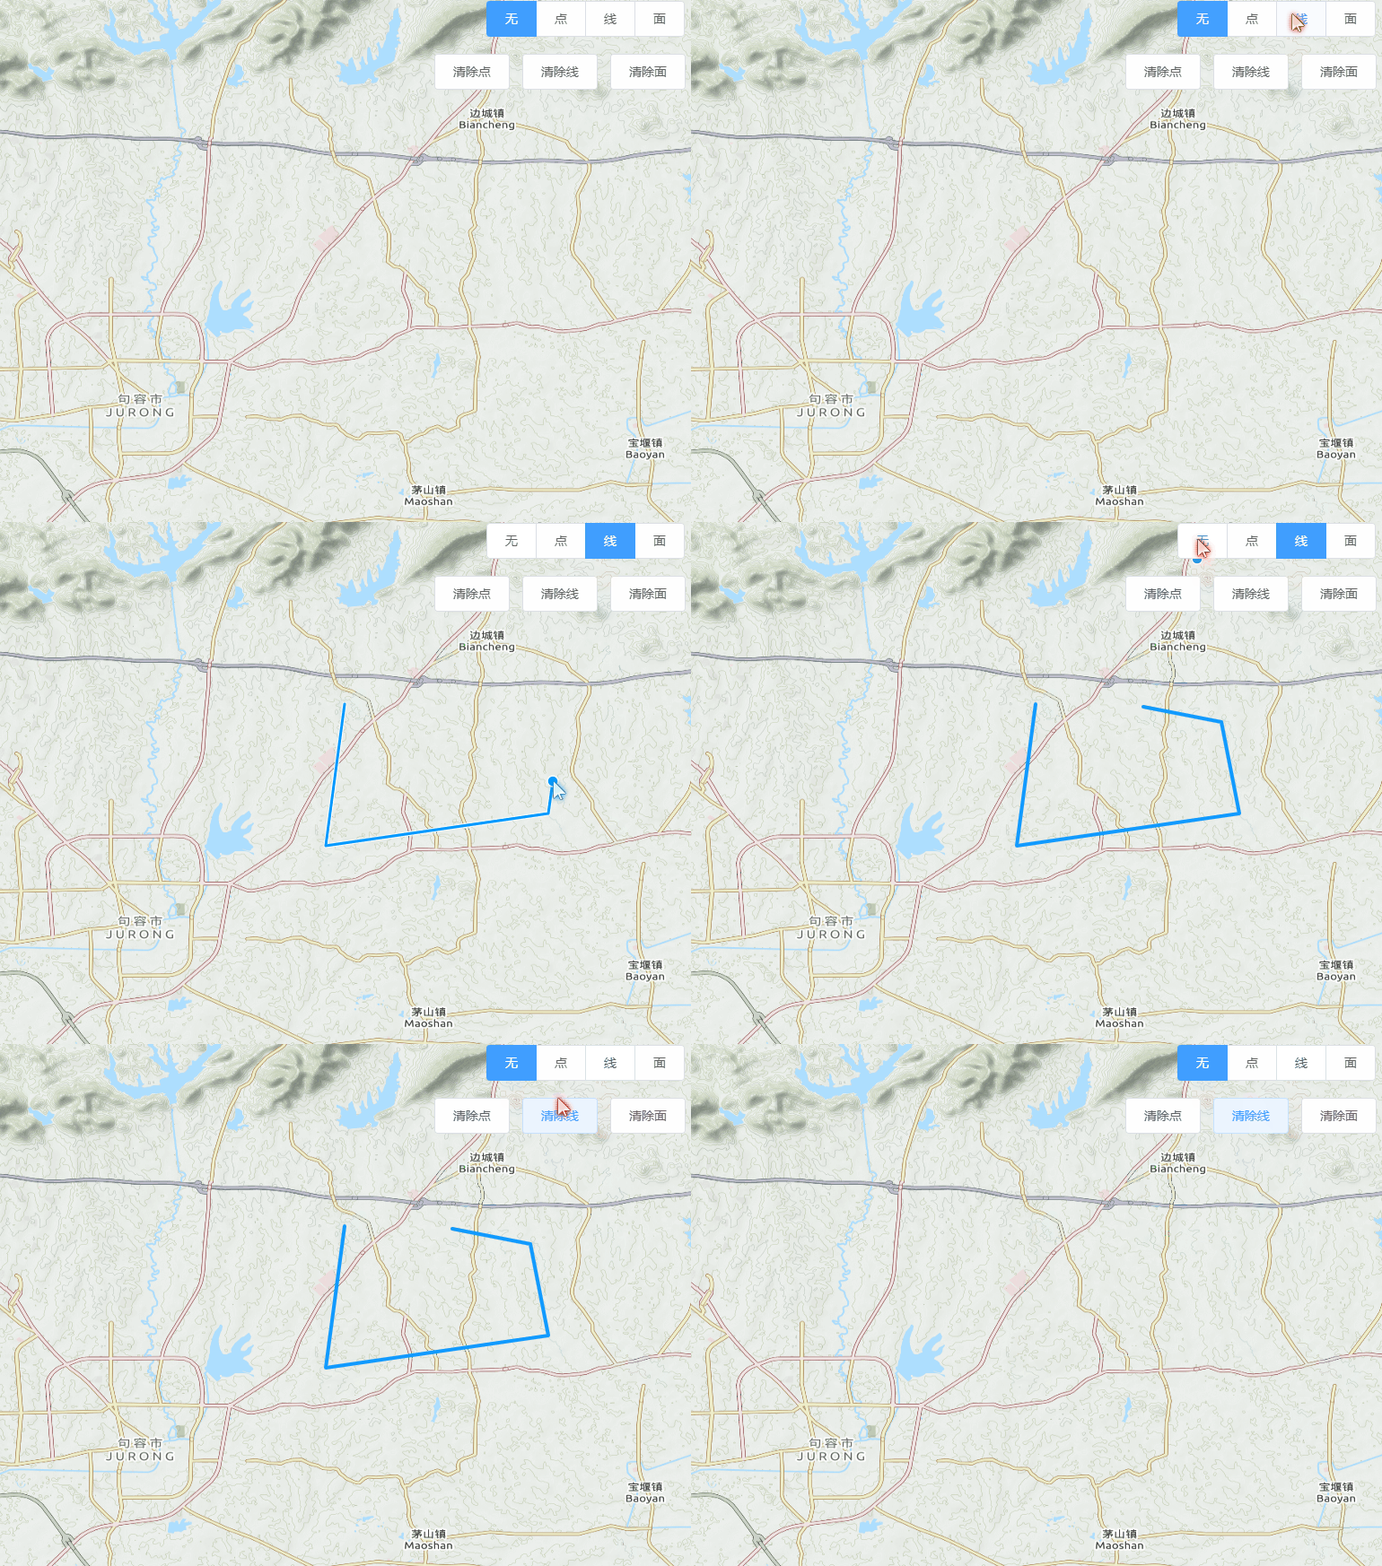
初学openlayers 有不足之处还望轻喷,多谢
项目用的是vue,elementUI,以及scss
啊…本来点线面都录制了一个gif图,因为某些原因 只剩下一个线的了,将就看着吧

在画线和面的时候,双击地图为停止绘制,也可以通过切换绘制属性手动停止绘制,具体内容注释里有
还有 我的点用的图片是static/img/marker.png,请根据情况替换路径
<
template
>
<
div id
=
"map_box"
>
<
div id
=
"map"
>
<
/
div
>
<
div
class
=
"btn_box"
>
<
el
-
radio
-
group v
-
model
=
"onTool"
>
<
el
-
radio
-
button label
=
"none"
>
<
/
el
-
radio
-
button
>
<
el
-
radio
-
button label
=
"Point"
>
点
<
/
el
-
radio
-
button
>
<
el
-
radio
-
button label
=
"LineString"
>
线
<
/
el
-
radio
-
button
>
<
el
-
radio
-
button label
=
"Polygon"
>
面
<
/
el
-
radio
-
button
>
<
/
el
-
radio
-
group
>
<
/
div
>
<
div
class
=
"clearBtn"
>
<
el
-
button @click
=
"clearFeature('Point')"
>
清除点
<
/
el
-
button
>
<
el
-
button @click
=
"clearFeature('LineString')"
>
清除线
<
/
el
-
button
>
<
el
-
button @click
=
"clearFeature('Polygon')"
>
清除面
<
/
el
-
button
>
<
/
div
>
<
/
div
>
<
/
template
>
<
script
>
export
default
{
props
:
[
]
,
data
(
)
{
return
{
onTool
:
'none'
,
map
:
{
}
,
draw
:
{
}
,
toolLayer
:
{
}
mounted
(
)
{
this
.
initMap
(
)
this
.
initToolLayer
(
)
methods
:
{
initMap
(
)
{
let
self
=
this
let
center
=
[
119.17
,
31.95
]
;
let
mapLayer
=
new
ol
.
layer
.
Tile
(
{
source
:
new
ol
.
source
.
XYZ
(
{
url
:
`https://{a-c}.tile.thunderforest.com/cycle/{z}/{x}/{y}.png?apikey=0e6fc415256d4fbb9b5166a718591d71`
}
)
,
this
.
map
=
new
ol
.
Map
(
{
target
:
document
.
getElementById
(
'map'
)
,
layers
:
[
mapLayer
view
:
new
ol
.
View
(
{
projection
:
'EPSG:4326'
,
center
:
center
,
zoom
:
12
}
)
,
interactions
:
ol
.
interaction
.
defaults
(
{
doubleClickZoom
:
false
,
dragPan
:
true
}
)
;
self
.
map
.
on
(
'click'
,
function
(
e
)
{
console
.
log
(
e
)
;
initToolLayer
(
)
{
this
.
toolLayer
.
Point
=
new
ol
.
layer
.
Vector
(
{
source
:
new
ol
.
source
.
Vector
(
{
wrapX
:
false
}
)
,
zIndex
:
9
,
style
:
new
ol
.
style
.
Style
(
{
image
:
new
ol
.
style
.
Icon
(
{
src
:
'static/img/marker.png'
,
this
.
toolLayer
.
LineString
=
new
ol
.
layer
.
Vector
(
{
source
:
new
ol
.
source
.
Vector
(
{
wrapX
:
false
}
)
,
zIndex
:
9
,
style
:
new
ol
.
style
.
Style
(
{
stroke
:
new
ol
.
style
.
Stroke
(
{
width
:
4
,
color
:
"#119aff"
this
.
toolLayer
.
Polygon
=
new
ol
.
layer
.
Vector
(
{
source
:
new
ol
.
source
.
Vector
(
{
wrapX
:
false
}
)
,
zIndex
:
9
,
style
:
new
ol
.
style
.
Style
(
{
stroke
:
new
ol
.
style
.
Stroke
(
{
width
:
4
,
color
:
"#119aff"
}
)
,
fill
:
new
ol
.
style
.
Fill
(
{
color
:
"rgba(57,160,255,0.5)"
for
(
let
k
in
this
.
toolLayer
)
{
this
.
map
.
addLayer
(
this
.
toolLayer
[
k
]
)
interaction
(
)
{
if
(
this
.
onTool
!==
'none'
)
{
this
.
draw
=
new
ol
.
interaction
.
Draw
(
source
:
this
.
toolLayer
[
this
.
onTool
]
.
getSource
(
)
,
type
:
this
.
onTool
,
stopClick
:
true
this
.
map
.
addInteraction
(
this
.
draw
)
this
.
draw
.
on
(
"drawend"
,
(
evt
)
=>
{
if
(
evt
.
feature
!=
null
)
{
evt
.
feature
.
getGeometry
(
)
.
getCoordinates
(
)
}
,
this
)
;
removeInteraction
(
)
{
this
.
map
.
removeInteraction
(
this
.
draw
)
clearFeature
(
layer
)
{
this
.
toolLayer
[
layer
]
.
getSource
(
)
.
clear
(
)
watch
:
{
onTool
(
val
)
{
this
.
removeInteraction
(
)
this
.
interaction
(
)
<
/
script
>
<
style lang
=
"scss"
>
#map_box
{
height
:
100
%
;
#map
{
width
:
100
%
;
height
:
100
%
;
.
btn_box
{
position
:
fixed
;
top
:
.5
em
;
right
:
.5
em
;
.
ol
-
zoom
{
top
:
auto
;
left
:
auto
;
right
:
.5
em
;
bottom
:
.5
em
;
.
ol
-
attribution
{
display
:
none
;
.
clearBtn
{
position
:
fixed
;
top
:
5.5
rem
;
right
:
.5
rem
;
<
/
style
>
openlayers绘制自定义点线面样式,带清除功能初学openlayers 有不足之处还望轻喷,多谢项目用的是vue,elementUI,以及scss啊…本来点线面都录制了一个gif图,因为某些原因 只剩下一个线的了,将就看着吧在画线和面的时候,双击地图为停止绘制,也可以通过切换绘制属性手动停止绘制,具体内容注释里有<template> <div id="ma...
<link rel=stylesheet href=<%= BASE_URL %>./css/gr-ol.css type=text/css>
[removed]./js/ol.js type=text/javascript>[removed]
这里
地图
为公共组件,方法写在公共组件的init方法里,kpst._this为
地图
对象
//测距/面
var draw = me.
var ces = new ol.source.Vector();
cesguan = new ol.Feature({
geometry: new ol.geom.Point([113.7538, 31.0008]),
ces.addFeature(cesguan);
cesLayer1 = new ol.layer.Vector({
source: ces,
style: new ol.style.Style({
image: new ol.style.Icon({
// colo
Vue
是一个流行的JavaScript框架,用于构建用户界面。
OpenLayers
是一个开源的地理信息系统(GIS)库,用于在网页上展示和处理地理空间数据。
Vue
OpenLayers
6是将这两个技术结合起来使用的一个项目。
Vue
OpenLayers
6的核心是利用
Vue
组件化的特点,将
OpenLayers
的
地图
组件集成到
Vue
应用中。使用
Vue
的语法和特性,可以更方便地管理
地图
相关的状态和交互。
在
Vue
OpenLayers
6项目中,可以创建一个
地图
组件,使用
OpenLayers
提供的API来配置
地图
的
样式
、图层、控件等。通过
Vue
的数据驱动机制,可以根据应用状态的改变,动态更新
地图
的展示内容。
此外,
Vue
OpenLayers
6还充分利用
Vue
的生命周期钩子函数,提供了方便的
地图
管理
功能
。在组件的created钩子函数中,可以初始化
地图
实例;在组件的mounted钩子函数中,可以将
地图
渲染到指定的DOM元素上。同时,提供了其他钩子函数和方法,以便在
地图
组件的生命周期中处理一些逻辑或更新
地图
的状态。
总结来说,
Vue
OpenLayers
6是一个使用
Vue
框架和
OpenLayers
库开发地理信息应用的工具。它通过集成和充分利用
Vue
和
OpenLayers
的特性,提供了方便的
地图
管理和交互的能力,在开发体验和效果上都有很大的提升。
