


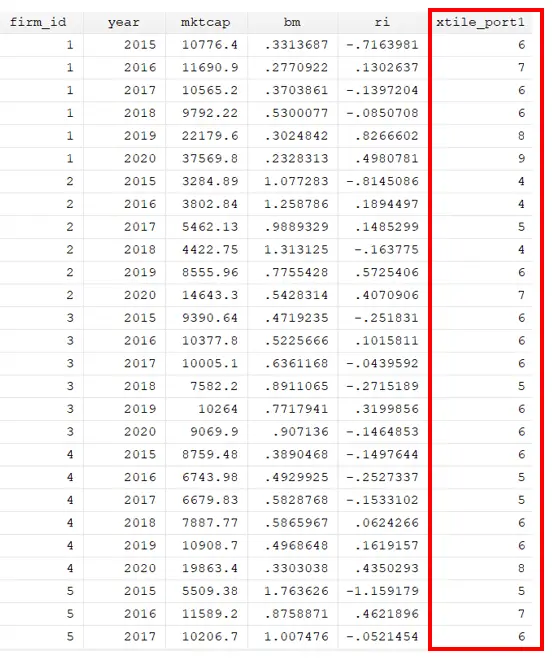
In this article, we will shed light on the portfolio’s construction and how its returns (both value weighted and equally weighted returns) can be calculated. The data required to construct the portfolio and return is shown in the figure below. The data set is a panel that includes multiple firms’ data for years.
Download Example File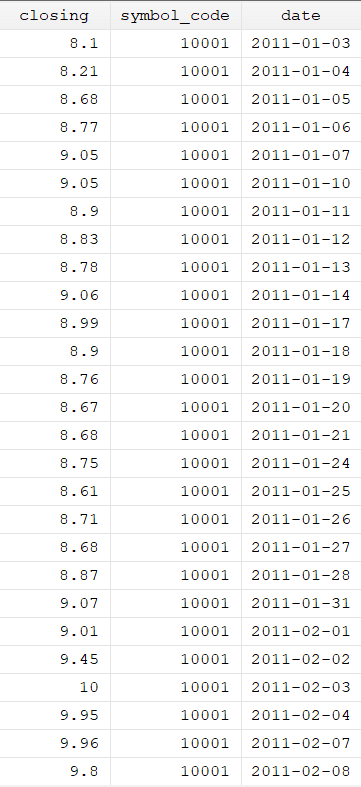
The command used to construct the portfolio is xtile. xtile command can be used as both a function and a command. First, we will see how it can be used as a function, and second, we will see how we can use it as a command
Xtile as a Function
egen xtile_port1 = xtile(mktcap), nq(10)
Initially, the portfolio generation process will be initiated with the e gen command. The function of this command is to generate a variable. Next, we will specify the name we want to assign to the variable holding our portfolio data (xtile_port1). After the equals sign, we will employ the xtile function. The variable name on the base we want to generate portfolio generation will be specified within the brackets. In our case, it is mktcap (market capitalization). Lastly, the number of portfolios to be generated will be denoted within the brackets labeled as nq .
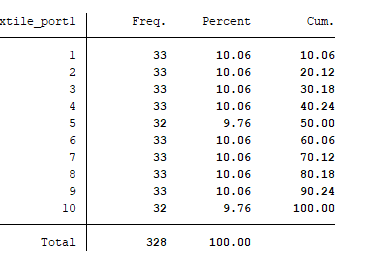
We can use the below command to see how many observations each portfolio comprises.
tab xtile_port1
Xtile as a Command
Another approach to generating a portfolio involves utilising the xtile as a command. The syntax where xtile can be used as the command is given below:
xtile temp=mktcap,nq(10)