- 输入网页链接,自动生成快照
- 标签化管理网页链接
|
|
闯红灯的冰棍 · Untouch推移动端3D手势交互 ...· 2 月前 · |
|
|
空虚的南瓜 · 请用python ...· 4 月前 · |
|
|
高大的电影票 · ChristineB - 影视搜索 - 好看网· 8 月前 · |
|
|
从容的绿豆 · qt里面实现自定义标题栏 ...· 9 月前 · |
|
|
宽容的野马 · 用于检测小儿创伤患者颈椎损伤的分诊工具 - ...· 11 月前 · |

Terrestrial plants are regularly subjected to strong temperature variations. These variations can reach an amplitude of 40°C or even more, both in polar regions and in hot desert areas. Being rooted, they have reduced mobility and must cope with changes in their environment. The assimilation of CO 2 by plants via photosynthesis is the gateway to carbon in the biosphere. What is the thermal amplitude that allows it to function? How does photosynthesis reacts to rapid and slow temperature variations? What is the diversity of responses? What are the physiological processes that limit it? Crucial questions tare o be considered in the context of global warming.
- 1. Plant production and climate change
- 2. The thermal optimum of photosynthesis
- 3. CO2 assimilation results from the interaction of processes whose response to temperature is different
-
4. What are the processes at work in setting the thermal optimum for CO2 assimilation in C3 and C4 plants?
- 4.1. Photosystem activity and the resulting electron transfer are not involved
- 4.2. An answer? Comparison of the effect of atmospheric O2 on CO2 assimilation of C3 and C4 plants
- 4.3. Rubisco properties explain the difference in response
- 5. The thermal optimum of C3 photosynthesis is modulated by certain environmental parameters
- 5.1. The CO2 content in the atmosphere
- 5.2. Lack of water
- 6. Why, from its thermal optimum, CO2 assimilation decreases as temperature decreases or increases?
- 7. Hardening after plant exposure to cool (≤ about 10°C) and high (≥ about 37°C) temperatures
- 8. Effects of temperature on photosynthesis: summary diagram
- 9. Messages to remember
1. Plant production and climate change
The current increase in greenhouse gas emissions will cause an increase in atmospheric temperature of 2 to 3°C in the next 50 years (see A carbon cycle disrupted by human activities ). At the same time, heat waves and extreme heat periods will be more frequent and of longer duration [1] . Agricultural production and the functioning of forests will therefore be greatly affected. Models based on large-scale observations indicate that, in the absence of agronomic adaptation, the decrease in crop yields can reach 17% for each 1°C increase in the temperature of the growing season [2] .
The production of higher plants depends in particular (but not only [3] ) on leaf photosynthesis (see Shedding light on photosynthesis & The The path of carbon in photosynthesis ). CO 2 enters the leaf where its reduction in the chloroplasts is accompanied by O 2 production. Its entry is almost exclusively through the stomata (Figure 1). For each molecule of CO 2 absorbed, 50 to 300 molecules of water are transpired from the leaves, depending on the plant. This water allows, among other things, the cooling of the leaf (see Focus Leaf transpiration and heat protection ).
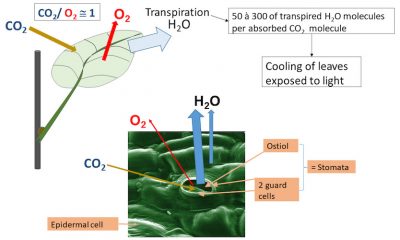
The climate changes that are currently occurring make it necessary to understand the effects of temperature on photosynthesis.
2. The thermal optimum of photosynthesis
2.1. Diagram of the thermal response
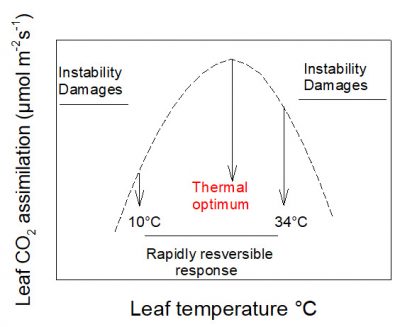
Photosynthetic CO 2 uptake varies with temperature. In most cases its response to temperature is rapidly reversible between about 10 and 34°C . In this range of temperatures it presents a maximum value: a thermal optimum .
2.2. A thermal optimum based on the average temperature of the environment
Plants in cold environments or with a cold growing season have a higher photosynthesis at low temperatures. Plants in warm environments, or growing during the warm season, have a higher photosynthesis at high temperatures.
2.3. Acclimatization to the thermal conditions of the environment
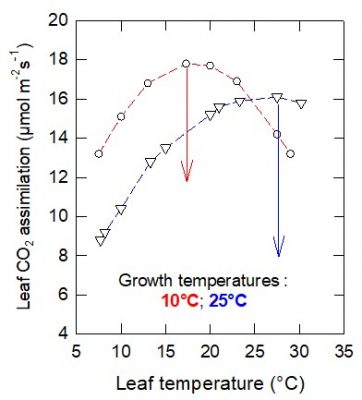
In the first case (cultivation at 10°C) the thermal optimum is about 16°C, while it is higher than 25°C in the second (cultivation at 25°C). At low temperatures, CO 2 assimilation is higher in plants grown at 10°C.
In this case the adjustment to cool conditions is a gain for the plant.
2.4. Acclimatization can be rapid


In general, these changes can be measured in both growing and mature leaves, with the response being of greater amplitude in growing leaves.
2.5. Heat-sensitive versus cold-sensitive species
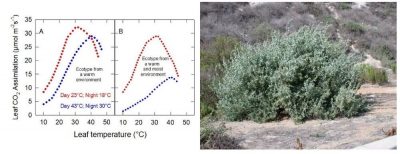
Warm acclimation of cool-adapted species (or ecotypes [6] ) occurs with an increase in thermal optimum but a general decrease in photosynthesis .
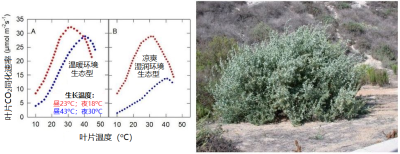
This is, for example, the case of Atriplex sabulosa . One can then wonder about the interest of this change. The opposite may be true for plants strictly adapted to warm conditions, such as Tridestomia oblongifolia . Figure 7 illustrates the case of Atripex lentiformis , [7] a perennial leafy plant, which occurs in California in both Death Valley and in cool, wet coastal habitats:
2.6. C3 plants versus C4 plants

C4 plants, of which there are traces only from the end of the Tertiary Era, constitute only 5% of the species. They tend to colonize hot and dry environments (or seasons) (See Restoring savannas and tropical herbaceous ecosystems ). Maize and sugarcane are examples.
On average, the thermal optimum of C4 plants is located at higher temperatures than that of C3 plants.
However, C3 plants are the most plastic . In fact, their thermal optimum varies from around 7 to 35 ° C, while that of C4 plants oscillates, with a few exceptions, between 30 and 40 ° C. In addition, when the temperature is below 20 ° C, the photosynthesis of C4 plants is on average lower than that of C3 plants.
3. CO 2 assimilation results from the interaction of processes whose response to temperature is different
The absorption of light at the collecting antennae
(Figure 9) and the transfer of its energy to the PSII reaction centres are
not temperature sensitive
.
Are temperature sensitive:
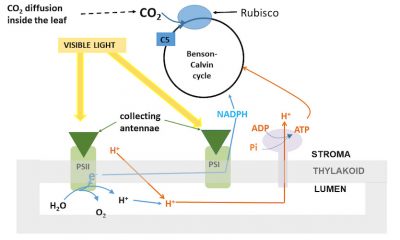
The formation of reducing power and the synthesis of ATP have a thermal sensitivity close to that of electron transfer.
4. What are the processes at work in setting the thermal optimum for CO 2 assimilation in C3 and C4 plants?
4.1. Photosystem activity and the resulting electron transfer are not involved
Measured in vitro on isolated thylakoids (see legend Figure 9), in the presence of artificial acceptors, electron transfer increases with temperature and shows a clear thermal optimum . It is located around 30°C and corresponds to that of CO 2 assimilation when the latter is saturating [9] . The activity of PSII has a thermal optimum identical to that of the electron transfer chain.
The thermal response of electron transfer
is
similar
in
C3 and C4
plants. However, there are organizational differences between these two types of plants (see
The path of carbon in photosynthesis
).
The supply of energy cannot therefore explain the differences in thermal optimum. It is the
way in which the energy produced is used that makes the difference
.
4.2. An answer? Comparison of the effect of atmospheric O 2 on CO 2 assimilation of C3 and C4 plants
4.3. Rubisco properties explain the difference in response
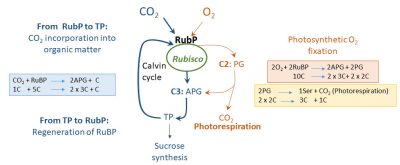
CO 2 and O 2 compete to occupy the active sites of Rubisco: This enzyme has a carboxylase function and an oxygenase function. CO 2 enters the Benson-Calvin cycle and the photosynthetic fixation of O 2 is at the origin of a metabolic pathway responsible for photorespiration (Figure 11; see also The path of carbon in photosynthesis ).
CO 2 occupies a high number of active sites on the Rubisco when the O 2 content of the ambient air is low (1% for example) or that of CO 2 is high.
O 2 is mainly fixed if its content increases or if that of CO 2 decreases (the latter then releases active sites which are then occupied by O 2 ) .
In normal air , there are two reasons why O 2 fixation increases (and consequently CO 2 fixation decreases) when the temperature increases [11] .
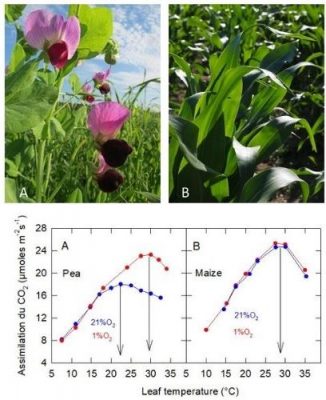
In an O 2 -poor atmosphere (Figure 10), competition between O 2 and CO 2 is very reduced. Energy is then used mainly for CO 2 assimilation, which increases in value until around 30°C and then decreases as the energy supply decreases (see section 4.1).
In normal air, the effect of O 2 on photosynthetic CO 2 fixation (Figure 11) is very low (or even nil) when the temperature is low : competition on the carboxylation sites is in favour of CO 2.
On the other hand, when the temperature increases , the competition on these sites favours the fixation of O 2 which then consumes an increasing part of the energy produced by the activity of the photosystems. This energy is therefore no longer available for CO 2 fixation, which reaches its maximum value around 22°C.
CO 2 is concentrated at the Rubisco by a mechanism that is insensitive to oxygen. Its content can reach 800 to 2000 ppm depending on the plant in C4: that is to say contents from 2 to 5 times higher than its current atmospheric content .
Under these conditions, photosynthetic O 2 fixation is weak or even non-existent because the active sites of the Rubisco are all occupied by CO 2 . The energy supplied by the activity of the photosystems is therefore used only in the fixation of CO 2 when the leaf temperature increases, explaining the higher thermal optimum in this type of plant.
C4 plants evolved from C3 plants during the global decrease in atmospheric CO 2 content at the end of the Tertiary Era [12] .
This decrease would then have “released” the oxygenase function of the Rubisco of C3 plants, resulting in a loss of fixed carbon via photorespiration.
The establishment of a CO 2 concentration mechanism is an advantage because it prevents this carbon loss . We currently find species that are “ intermediates ” between C3 and C4.
5. The thermal optimum of C3 photosynthesis is modulated by certain environmental parameters
5.1. The CO 2 content in the atmosphere
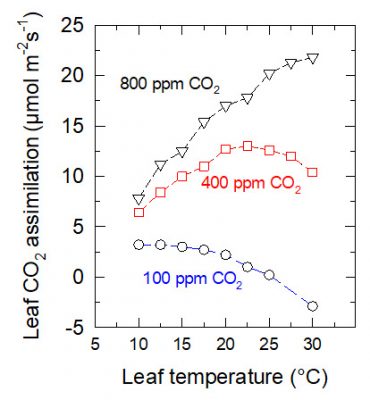
The thermal optimum increases with increasing ambient CO 2 content. In the case shown in Figure 12, it increases from about 10°C when the content is 100 ppm to more than 30°C when it is 800 ppm.
5.2. Lack of water
The photosynthetic apparatus is resistant to drought . It retains all its capacity to absorb CO 2 on the Rubisco, and to produce energy until the leaves have lost about 30% of their water [13] .
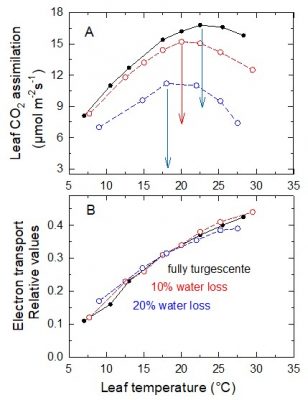
This is shown in Figure 14A, in which the thermal optimum drops from about 23°C, in a Pea leaf at maximum turgor, to 17°C when it has lost 20% of its water.
Electron transfer in the thylakoid membrane is not affected by water loss in the range shown (Figure 14B). When water loss is 20%, the energy produced by photosystem activity is primarily used to bind atmospheric oxygen to RuBP [14] , resulting in increased photorespiration.
6. Why, from its thermal optimum, CO 2 assimilation decreases as temperature decreases or increases?
6.1. When the temperature lowers
Several reasons probably all contribute, to varying degrees, to this decrease :
In C4 plants it is the activity of the Rubisco that appears to be preponderant, although the cold sensitivity of enzymes involved in CO 2 accumulation at the Rubisco is well known.
6.2. As the temperature increases
In C3 plants the increase in photorespiration decreases the fraction of electrons produced by PSII and used to assimilate CO 2 . However, other factors are at play since CO 2 assimilation measured (1) in an atmosphere with little or no photorespiration (ambient O 2 content of 1%), and (2) measured in a normal atmosphere in a C4 plant decreases in both cases (Figure 10).
Several reasons can be given:
In C4 plants (case of Maize) the activation and activity of enzymes that participate in the CO 2 concentration system at the Rubisco are not very sensitive to high temperatures. The same reasons as above may explain the decrease in CO 2 assimilation when the temperature increases beyond that of the thermal optimum.
7. Hardening after plant exposure to cool (≤ about 10°C) and high (≥ about 37°C) temperatures
Maintaining plants at cool or high temperatures causes, along with the changes in photosynthesis described above, increase in their resistance to otherwise lethal temperatures (frost and high temperature). This is hardening.
In this process, temperature and light interact and the metabolic changes induced are sometimes very rapid (from minutes to hours).
Thus, cold hardening can be achieved at ordinary temperature by modulating the length of the light period or its spectral composition in the red [16] . However, cold is still required to achieve full hardening. Also the lack of light in the cold prevents hardening to varying degrees .
Note that the signaling pathways and their interactions inducing the genome response are only partially known. The references given in “Learn More” and an attached Focus allow for further exploration of this evolving point.
8. Effects of temperature on photosynthesis: summary diagram
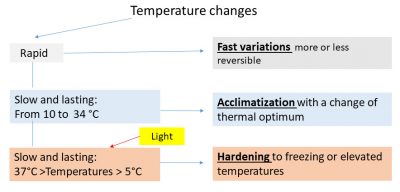
The summary diagram (Figure 15) classifies the effects of temperature on photosynthesis according to the speed of temperature change and the extent of its variation. Note that hardening allows leaf maintenance in perennial leaf plants and therefore minimizes energy loss under extreme temperature conditions.
9. Messages to remember
Notes and references
Cover image. Sunset over the Sonora Arizona desert. [Source: royalty free / Pixabay]
[1] Meehl GA, Stocker TF, Collins WD, Riedlingstein P, Gaye AT, Gregory JM, Kitoh A, Knutti R, Murphy JM, Noda A & Raper SCB (2007). Climate Change 2007: The Physical Science Basis . Contribution of Working Group I to the Fourth Assessment Report of the Intergovernmental Panel on Climate Change. Cambridge University Press
[2] Yamori W, Hikosaka K & Way DA. (2014). Temperature response of photosynthesis in C3, C4, and CAM plants: temperature acclimation and temperature adaptation. Photosynthesis Res . 119, 101- 117.
[3] For example, when growing plants are subjected to drought, the amount of carbon they assimilate decreases initially because leaf growth is inhibited. The mechanisms for CO 2 fixation in the leaf are not then inhibited. Boyer JS (1970) Plant Physiol. 46, 233-235
[4] The values of thermal optima given here, are from measurements made in “normal air”, containing 21% O 2 and about 400 ppm CO 2 . When this is not the case the O 2 and CO 2 contents are shown. The CO 2 uptake in air containing 21% O 2 is saturated from about 1200 ppm CO 2 when light is close to saturation. The evaporative power of the air is also regulated in most cases during the measurements. It is estimated by the saturation deficit of the partial pressure of water vapor in the ambient air around the leaves.
[5] Plants from the same individual by vegetative reproduction. They are genetically identical.
[6] Ecotype: Plants of the same species from different environments, which, grown from seed to flower under identical conditions show different physiological characteristics.
[7] It fetches water from as far as the water table, hence its name of phreatophyte plant.
[8] Pearcy RW (1971). Acclimation of photosynthetic and respiratory CO 2 exchange to growth temperature in Atriplex lentiJormis (Torr.) Wats. Plant Physiol. 59, 795-799
[9] Yamasaki T, Yamakawa T, Yamane Y, koike H, Satoh K & Katoh S. (2002) Temperature acclimation of photosynthesis and related changes in photosystem II electron transport in winter wheat. Plant Physiol . 128 1087-1097.
[10] See note #4, section 2.2
[11] Jordan DB & Ogren WL (1984). The CO 2 /O 2 specificity of ribulose 1,5-bisphosphate carboxylase/oxygenase. Dependence on ribulose bisphosphate concentration, pH and temperature. Planta 161 , 308-313
[12] Ehleringer JR, Sage RF, Flanagan LB & Pearcy RW (1991). Climate change and the evolution of C4 photosynthesis. Trends in Ecology and Evolution 6, 95-99
[13] Cornic G & Massacci A (1996). Leaf photosynthesis under drought stress. In Advances in Photosynthesis ( vol 5 ) Photosynthesis and the environment , 347-366. Neil R Baker (ed.) Kluwer Academic publishers Dordrecht.
[14] Cornic G, Badeck F-W, Ghashghaie J & Manuel N (1999). Effect of temperature on net CO 2 uptake, stomatal conductance for CO 2 and quantum yield of photosystem II photochemistry of dehydrated pea leaves. In Sanchez Dias M, Irigoyen JJ, Aguirreolea J & Pithan K (eds) Crop development for cool and wet regions of Europe . European community. ISBN 92-828-6947-4.
[15] Crafts-Brandner SJ, van de Loo FJ & Salvucci ME (1997). The two forms of ribulose-1,5-bisphosphate carboxylase/oxygenase activase differ in sensitivity to elevated temperature. Plant Physiol. 114, 439-444.
[16] Puhakainen T, Li C, Boije-Malm M, Kangasjärvi J, Heino P & Palva ET. (2004). Short-day potentiation of low temperature-induced gene expression of a C-repeat-binding factor-controlled gene during cold acclimation in Silver Birch. Plant Physiol. 136, 4299-4307
The Encyclopedia of the Environment by the Association des Encyclopédies de l'Environnement et de l'Énergie ( www.a3e.fr ), contractually linked to the University of Grenoble Alpes and Grenoble INP, and sponsored by the French Academy of Sciences.
To cite this article: CORNIC Gabriel (September 27, 2021), Effects of temperature on photosynthesis, Encyclopedia of the Environment, Accessed August 26, 2024 [online ISSN 2555-0950] url : https://www.encyclopedie-environnement.org/en/life/effects-temperature-on-photosynthesis/ .
The articles in the Encyclopedia of the Environment are made available under the terms of the Creative Commons BY-NC-SA license, which authorizes reproduction subject to: citing the source, not making commercial use of them, sharing identical initial conditions, reproducing at each reuse or distribution the mention of this Creative Commons BY-NC-SA license.
Author(s)
Article outline
- 1. Plant production and climate change
- 2. The thermal optimum of photosynthesis
- 3. CO2 assimilation results from the interaction of processes whose response to temperature is different
-
4. What are the processes at work in setting the thermal optimum for CO2 assimilation in C3 and C4 plants?
- 4.1. Photosystem activity and the resulting electron transfer are not involved
- 4.2. An answer? Comparison of the effect of atmospheric O2 on CO2 assimilation of C3 and C4 plants
- 4.3. Rubisco properties explain the difference in response
- 5. The thermal optimum of C3 photosynthesis is modulated by certain environmental parameters
- 5.1. The CO2 content in the atmosphere
- 5.2. Lack of water
- 6. Why, from its thermal optimum, CO2 assimilation decreases as temperature decreases or increases?
- 7. Hardening after plant exposure to cool (≤ about 10°C) and high (≥ about 37°C) temperatures
- 8. Effects of temperature on photosynthesis: summary diagram
- 9. Messages to remember
Focus
Learn more
The path of carbon in photosynthesis
04-03-2020
How is the carbon from carbon dioxide – CO2 – present in the atmosphere integrated…
Jean-François MOROT-GAUDRY , INRA Emeritus Research Director, the Jean-Pierre Bourgin Institute, INRA Versailles, Member of the Académie d’Agriculture.
Pressure, temperature and heat
05-02-2019
Pressure, temperature and heat are quantities used in everyday life, especially in meteorology. Their physical…
Joël SOMMERIA , CNRS Research Director, LEGI (Laboratoire des Écoulements Géophysiques et Industriels), Université Grenoble-Alpes.
The average temperature of the earth
29-07-2020
Global climate change is a major concern. It is based on the scientific community’s statement…
Serge PLANTON
, General engineer of bridges, waters and forests, former climatologist researcher at Météo-France, CNRM (Centre National de Recherches Météorologiques).
PDF

陆生植物经常受到温度剧烈变化的影响,无论是在极地还是在炎热的沙漠地区,温度的变化幅度可以达到40 °C甚至更高。陆生植物扎根后就几乎不能移动,因此,它们必须应对原位环境的变化。植物通过光合作用同化二氧化碳,这是碳进入生物圈的起点。光合作用正常工作的温度范围是多少?光合作用对快速和缓慢的温度变化如何响应?不同植物的响应有何差异?限制光合作用的生理过程是什么?这些关键问题都需要我们在全球变暖的背景下加以考虑。
1. 植物生产与气候变化
从目前温室气体排放增加的趋势来看,未来50年内大气温度可能升高2-3°C(见“ 被人类活动干扰的碳循环 ” )。与此同时,热浪和极端高温事件将更加频发,持续时间也会更长 [1] 。农业生产和森林的功能将受到巨大的影响。基于大规模观察的模型表明,在缺乏农业适应性措施的情况下,生长季温度每升高1°C,作物产量下降可达17% [2] 。
高等植物的生产力 尤其(但不只是 [3] )依赖 叶片的光合作用 (参见“ 揭示光合作用的真相 ” 以及“ 光合作用的碳代谢路径 ”)。二氧化碳(CO 2 )进入叶片后在叶绿体中被还原,同时伴随着氧气(O 2 )的产生。二氧化碳几乎完全是通过保卫细胞进入叶片的(图1),每一个二氧化碳分子进入叶片,就会蒸发掉50-300个水分子,具体数值取决于植物种类和状态。蒸腾损失的水分除了其他功能外,还能使叶片冷却(参见“叶片蒸腾和热保护”)。
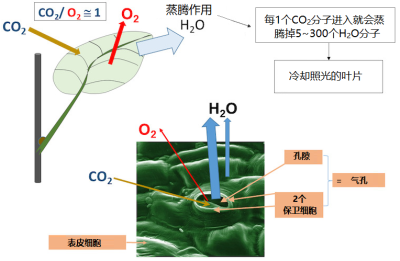
叶片将 太阳能转化为化学能 ,与任何能量转化器一样,它需要一个持久工作的 冷却系统 。
当前,气候变化正在发生,了解温度对光合作用的影响则更为必要。
2. 光合作用的最适温度
2.1. 温度响应图
光合作用中二氧化碳的吸收速率随温度而变化。大多数情况下,当温度在 10-34 °C之间 变化时 , 光合速率也会发生 快速可逆 的变化,并出现一个最大速率:即光合作用的 最适温度 。
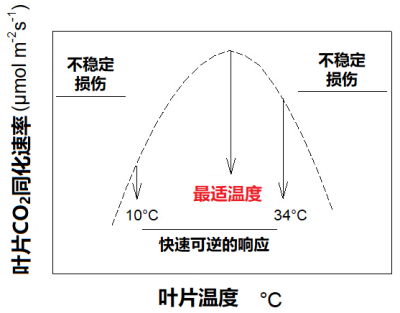
10°C以下和34°C以上对植物来说属于胁迫条件,它们会启动 保护机制 ,以应对此类极端温度。在此胁迫条件下,叶片的二氧化碳同化过程往往是不稳定的,甚至可能停止(图2)。
2.2. 基于环境平均温度的最适温度
在寒冷环境或寒冷季节生长的植物,低温下的光合速率更高;相反,在温暖环境或温暖季节生长的植物,高温下的光合速率更高。
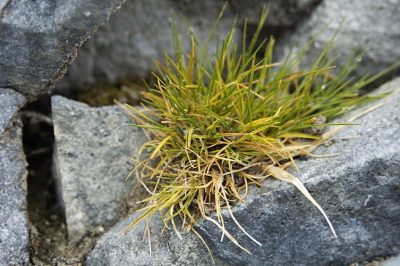
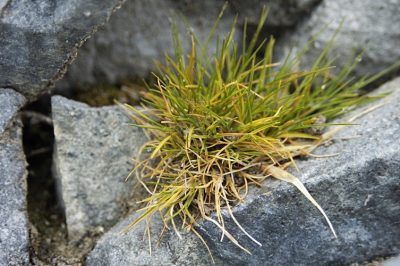
例如,南极仅有两种开花植物南极发草( Deschampsia antarctica ,图3)和南极漆姑草( Colobanthus quitensis ),它们的二氧化碳同化的最适温度都在8~15°C之间 [4] ,而来自中美洲炎热沙漠的植物( Tridestomia oblongifolia )的最适温度在45°C左右,这可能是有花植物的世界纪录。
2.3. 对环境温度条件的适应
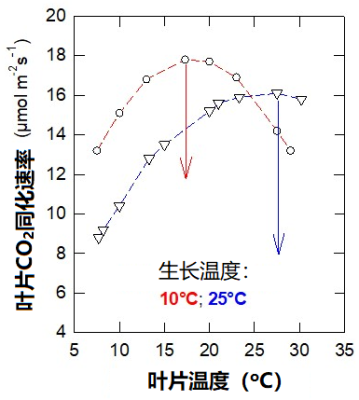
生长在不同温度下的同种植物个体,其光合作用对温度的响应也存在差异。图4显示了在10 °C和25 °C下生长的豌豆的二氧化碳吸收速率。
第一种情形为在10 °C下培养植物,其叶片光合作用的最适温度约为16 °C;而在第二种情形下,植物的培养温度是25 °C,此时的最适温度则高于25 °C。而且在较低温度下,在10 °C条件下生长的植物二氧化碳吸收速率更高。
在这种情况下,适应较冷的温度条件对植物来说是有利的。
2.4. 可以快速适应

例如,中东沙漠(内盖夫的瓦迪拉姆)中的一种灌木雷姆斯( Hamada scoparia )的光合作用随温度的季节变化而变化:最适温度从早春的29 °C升高到夏季的41 °C,再回落到秋季的28 °C。

光合最适温度的变化甚至可以更快,幅度也更大。例如,在加利福尼亚海滨的加州脆菊木( Encelia california )株丛 [5] ,当其生长温度从30 °C(昼夜恒定)变为白天15 °C、夜间2 °C,只需3天,其光合最适温度就会降低约10 °C。
一般来说,无论是还在生长的叶片还是已经成熟的叶片,都可以测量到这样的变化, 生长中的 叶片 响应幅度 往往更大。
2.5. 热敏植物与冷敏植物的比较
生活在冷凉环境的植物物种(或生态型 [6] )对高温的适应会伴随着 最适温度的升高 ,同时 光合速率 往往会 降低 。
例如,裂叶滨藜( Atriplex sabulosa )就是如此。这种变化的意义值得思考。而对于那些严格适应温暖环境的植物来说,情况可能正好相反,如 Tridestomia oblongifolia 。图7展示了大滨藜( Triplex lentiformis )的情况,它是一种多年生密丛生小灌木 [7] ,既分布在加州的死亡谷,也生长在凉爽湿润的沿海地带:
2.6. C3植物和C4植物的比较

C3植物 是最早出现的植物类群,约占现存植物物种的85%。它们主要生长在 凉爽湿润 的环境(或季节)。例如,树木中除了极个别外,其他都是C3植物(阅读“ 光合作用的碳代谢路径 ”)(图8)。
C4植物 始现于第三纪末期,仅占现存植物物种总数的5%。它们更喜爱 炎热、干燥 的环境(或季节)(参见“恢复热带稀树草原和热带草本生态系统”)。玉米和甘蔗就是C4植物。
平均而言, C4 植物的最适温度高于 C3植物。
但是, C3植物 具有 极强的适应性 。事实上,它们的最适温度范围很宽,从大约7 °C到35 °C左右,而C4植物的最适温度一般在30-40°C之间,只有很少例外。而且当温度低于20 °C时,C4植物的 平均光合速率低于 C3植物。
3. 二氧化碳同化是温度响应特征不同的诸过程相互作用的结果
捕集天线对光的吸收 (图9)和将光能转移到PSII反应中心的过程 对温度不敏感 。
温度敏感的过程包括:
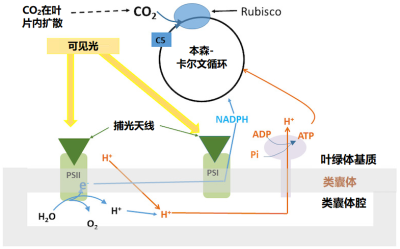
RuBP的再生是通过本森-卡尔文循环(Benson-Calvin cycle)(这是光合作用的“生物化学”过程)完成的,该循环需要电子传递生成的还原力(以NADPH的形式),还需要ATP,ATP是类囊体腔内积累的质子跨膜进入叶绿体基质时,推动ATP酶合成的(图9)。
生成还原力、合成 ATP 以及电子传递三个过程的温度敏感性相当。
4. C3和C4植物中,决定CO 2 同化最适温度的过程是什么?
4.1. 与光系统活性及此产生的电子传递过程无关
当存在人工电子受体时,对离体类囊体测量(见图9中的图例)发现,电子 传递 随温度升高而加快,明显存在最 适温度 ,大约为30 °C,与二氧化碳 饱和 时叶片吸收 CO 2 的最适温度相当 [9] 。PSII活性的最适温度与电子转移链的最适温度相同。
C3 和 C4 植物中电子传递对温度的反应相似。 但是,这两类植物的光合器官在结构上存在着差异(参见:“ 光合作用的碳代谢路径 ”)。
因此,能量供应并不能解释这两类植物光合最适温度的差异, 对能量的使用方式不同才是决定性因素。
4.2. 这是答案吗?大气中的氧气对C3和C4植物二氧化碳同化的影响
4.3. Rubisco的性质是差异的关键
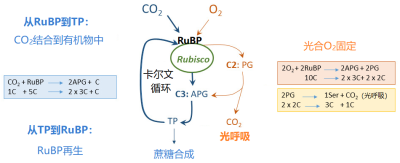
二氧化碳和氧气竞争Rubisco的活性位点:该酶同时具有羧化酶功能和加氧酶功能。二氧化碳通过其羧化酶功能进入本森-卡尔文循环的同时,其氧化酶功能导致 光合氧气固定 ,这是 光呼吸 代谢途径的起点(图11;另见:“ 光合作用的碳代谢路径 ”)。
当环境空气中氧气含量较低(例如1%)或二氧化碳含量较高时, 二氧化碳 会占据大量的Rubisco活性位点。
如果氧气含量增加,或者二氧化碳 含量减少(释放出Rubisco酶的活性位点,并被氧气占据),该酶就会主要固定氧气。
在 正常的空气 中,当 温度升高 时 氧气的固定增加 (因而二氧化碳的固定减少),原因有两个 [11] 。
一是 Rubisco 对二氧化碳的亲和力 下降幅度大于对氧气的亲和力,因而有利于氧气吸收。
二是 二氧化碳在水中的溶解系数比氧气下降更多,导致叶绿体中二氧化碳的含量下降比氧气快 ,这也有利于氧气固定。
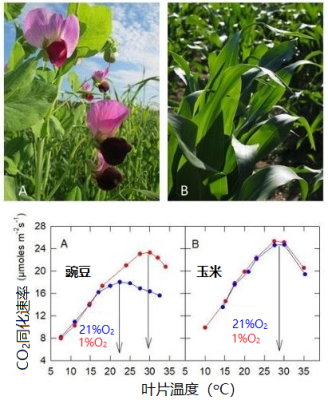
在 缺氧的大气 中(图10), 氧气和二氧化碳对Rubisco活性位点的竞争 会大大减弱,捕集的光能主要用于二氧化碳的吸收,二氧化碳吸收速率会随着叶片温度的升高而增加,直到30 °C左右达到最大,然后随着能量的减少而降低(见第4.1节)。
当 温度较低 时,在正常空气中的氧气对光合二氧化碳固定的影响(图11)非常低(甚至为零):此时二氧化碳在羧化位点上的竞争更有 优势 。
另一方面,当 温度升高 时,这些活性位点上的 竞争有利于氧气的固定 ,光系统捕获的太阳能越来越多地被氧气固定所消耗,而非用于二氧化碳的固定。二氧化碳固定速率在22 °C左右达到最大值。
二氧化碳通过一种对氧不敏感的机制在Rubisco附近富集,在不同C4植物叶片中含量可以达到 800 到 2000 μL/L :也就是比 当前大气中的含量高 2 到 5 倍 。
在此条件下,由于Rubisco的活性位点全部被二氧化碳占据,光合作用对氧气的固定作用很弱,甚至完全没有。因此,即使 叶片温度升高 ,光系统捕集的太阳 光能也仅用于二氧化碳固定 ,这就是C4植物的光合最适温度较高的原因。
C4植物是在第三纪末期全球 大气二氧化碳浓度下降 的过程中, 从 C3 植物 演化而来的 [12] 。
大气CO2浓度的降低使得C3植物Rubisco的加氧酶功能得以“发挥”,并通过光呼吸途径损失固定的碳。
因而,建立二氧化碳富集机制就成了一个 优势 ,可以 防止光呼吸碳损失 。我们现在还能够发现C3和C4“ 过渡类型 ”的植物物种。
5. C3光合途径的最适温度受某些环境因子的调控
5.1. 大气二氧化碳浓度
光合最适温度随环境二氧化碳含量的增加而提高。如图12所示,从二氧化碳含量为100 μL/L时的10 °C左右提高到含量为800 μL/L时的30 °C以上。
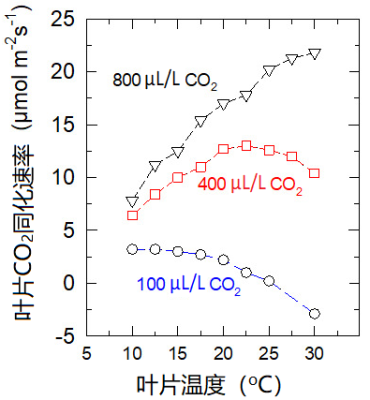
这一效应可以用二氧化碳和氧气竞争Rubisco的活性位点来解释:在二氧化碳浓度为800 μL/L时,活性位点主要被二氧化碳占据;而在二氧化碳浓度为100 μL/L时,氧气会占据大多数的活性位点。
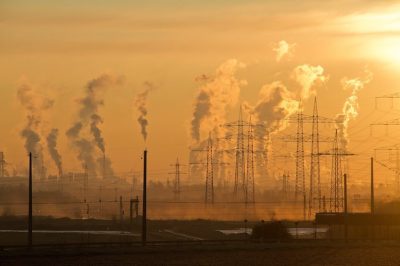
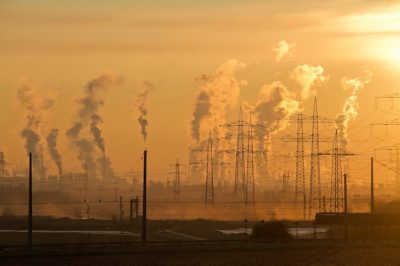
在 大气二氧化碳浓度稳步增加 的情况下(图13),C3植物的最适温度有望提升,但这并不意味着植物生产力的提高(参见第1部分注释3):因为像干旱一样, 高温时期 肯定会更 频繁地出现 。
5.2. 缺水
光合工具叶绿体本身有较强的抗旱性 ,叶绿体可以保持Rubisco吸收二氧化碳和固定光能的能力,直到叶片失去其含水量的30% [13] 。
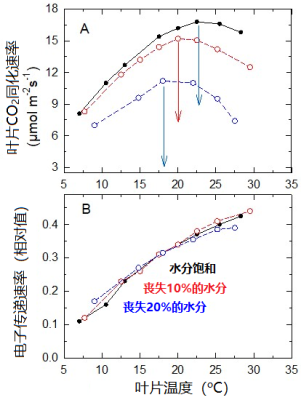
因此,C3植物的叶片在逐渐失水的过程中,其光合作用的最适温度也必须降低。
如图14A所示,豌豆叶片的最适温度从叶片水分饱和时的23 °C,下降到失去20%水分时的17 °C。
在实验中的水分丧失范围内(图14B),类囊体膜上的电子传递速率不受影响。当水分损失达20%时,光系统捕集的太阳能主要用于氧与RuBP结合 [14] ,导致光呼吸增加。
6. 为什么无论温度较最适宜温度升或降,二氧化碳吸收速率总是降低的?
6.1. 当温度低于最适温度时
可能有几个原因不同程度地导致了同化速率降低:
在C4植物中,光合作用对低温的响应主要受Rubisco活性的影响,当然,参与二氧化碳固定的其他酶对低温敏感也是众所周知的。
6.2. 当温度高于最适温度时
在 C3 植物中 ,随着温度升高,光呼吸增加, PSII产生的电子中用于同化二氧化碳的比例下降。除此之外,还有其他因素也在起作用:(1)即使在很少或没有光呼吸的大气条件(环境氧气含量为1%)下测量,也会发现光合速率随温度升高而降低;(2)在正常的大气条件下C4植物也有相同的表现 (图10)。可能的原因有:
在C4植物 (如玉米)中,负责二氧化碳富集在Rubisco周围的酶的激活及其活性对高温不太敏感。因此,C4植物在最适温度以上时,二氧化碳同化速率随着温度升高而下降。
7. 植物的低温(≤10 °C左右)和高温(≥37°C左右)锻炼
当植物停留在低温或高温环境下时,除了引发光合作用的上述变化外,还能 增强它们对致死温度 (霜冻和高温) 的抵抗力 ,这就是 抗性锻炼 。
在此过程中,温度和光照共同作用,引起代谢变化,这个变化有时非常快(从几分钟到几小时)。
因此, 通过改变光周期的长度或光谱中的红光成分 [16] ,可以在正常温度下实现抗寒锻炼。然而,要使抗性能力完全表现出来,仍然需要低温处理。 同样地,低温并缺乏光照的条件也会不同程度地降低抗寒锻炼的效果。
请注意,抗性锻炼过程中的信号通路以及它们如何相互作用以诱导基因组反应,目前 已知内容有限 。读者可以阅读“了解更多”中列出的参考资料和本文的推荐文献,进一步探索这一不断发展的主题。
8. 温度对光合作用的影响:总结图
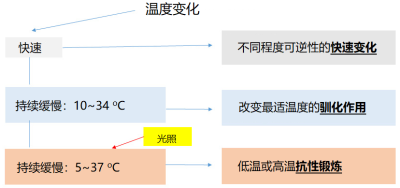
总结图(图15)根据温度变化的速度和程度,将温度对光合作用的影响进行了分类。请注意,抗性锻炼可以使植物的多年生叶片得以在极端温度条件下维持活性,因而最大限度地减少光能损失。
当前气候变化速度如此之快,我们必须更深入地研究植物对其环境的反应:以期维持足够的初级生产力,保持生物圈功能的可持续性。
9. 需要记住的信息
参考资料及说明
封面图片: 亚利桑那州索诺兰沙漠的日落。[来源:免版税/ Pixabay]
[1] Meehl GA、Stocker TF、Collins WD、Riedlingstein P、Gaye AT、Gregory JM、Kitoh A、Knutti R、Murphy JM、Noda A & Raper SCB(2007)《气候变化2007:物理科学基础》。第一工作组对政府间气候变化专门委员会第四次评估报告的贡献。剑桥大学出版社
[2] Yamori W, Hikosaka K & Way DA(2014)。C3、C4和CAM植物光合作用的温度响应:温度驯化和温度适应。光合作用 119, 101- 117。
[3] 例如,当植物遭受干旱时,叶片生长首先被抑制,导致碳固定速率下降。但是叶绿体中的二氧化碳固定过程没有受到抑制。Boyer JS (1970) Plant Physiol.46, 233-235
[4] 这里给出的最适温度是在 含 21% 的氧气和约 400 μL/L 二氧化碳 的“正常空气”中测量得出的。 其他条件则标出了氧气和二氧化碳的含量。 当接近饱和光强、含21% 氧气的空气条件下,光合速率的二氧化碳饱和点约为1200 μL/L。很多时候在测量过程中空气蒸发能力也会影响光合速率,这个参数是通过叶片周围空气中水汽分压的饱和亏缺来估算的。
[5] 通过营养繁殖从同一个体长出的不同植株,具有相同的基因。
[6] 生态型:生长在不同环境的同种植物,即使种植在相同的条件下,它们在从种子萌发到开花结实的过程中,也会表现出不同的生理特征。
[7] 它可以吸收土壤深处的地下水,因此被称为地下水湿生植物。
[8] Pearcy RW(1971)。triplex lentiJormis (Torr.)光合和呼吸二氧化碳交换对生长温度的适应寺庙。植物生理。59,795-799
[9] Yamasaki T, Yamakawa T, Yamane Y, koike H, Satoh K & Katoh S.(2002)冬小麦光合作用的温度适应及其光系统II电子传递的相关变化。Plant Physiol. 128 1087-1097
[10] 见2.2节的注释#4
[11] Jordan DB & Ogren WL(1984)。的有限公司2/ 氧气 核酮糖1,5-二磷酸羧化酶/加氧酶的特异性。二磷酸核酮糖浓度、pH和温度的依赖性。161年足底,308 – 313
[12] Ehleringer JR, Sage RF, Flanagan LB & Pearcy RW(1991)。气候变化与C4光合作用的演化。生态与进化趋势6,95-99
[13] Cornic G & Massacci A(1996)。干旱胁迫下的叶片光合作用。In Advances In光合作用(第5卷)光合作用与环境,347-366。尼尔R·贝克(主编)Kluwer学术出版社Dordrecht。
[14] Cornic G, Badeck F-W, Ghashghaie J & Manuel N(1999)。温度对CO净吸收二氧化碳、气孔导度的影响2 以及脱水豌豆叶片光系统II光化学的量子产率。In Sanchez Dias M, Irigoyen JJ, agureolea J & Pithan K (eds)欧洲凉爽潮湿地区的作物发育。欧洲共同体。ISBN 92-828-6947-4。
[15] Crafts-Brandner SJ, van de Loo FJ & Salvucci ME(1997)。两种形式的核酮糖-1,5-二磷酸羧化酶/加氧酶激活酶对高温的敏感性不同。植物生理。114,439-444。
[16] Puhakainen T, Li C, Boije-Malm M, Kangasjärvi J, Heino P & Palva ET.(2004)。在银桦冷驯化过程中,低温诱导c -重复结合因子控制基因表达的短日增强。植物136, 4299 – 4307
The Encyclopedia of the Environment by the Association des Encyclopédies de l'Environnement et de l'Énergie ( www.a3e.fr ), contractually linked to the University of Grenoble Alpes and Grenoble INP, and sponsored by the French Academy of Sciences.
To cite this article: CORNIC Gabriel (March 14, 2024), 温度对光合作用的影响, Encyclopedia of the Environment, Accessed August 26, 2024 [online ISSN 2555-0950] url : https://www.encyclopedie-environnement.org/zh/vivant-zh/effects-temperature-on-photosynthesis/ .
The articles in the Encyclopedia of the Environment are made available under the terms of the Creative Commons BY-NC-SA license, which authorizes reproduction subject to: citing the source, not making commercial use of them, sharing identical initial conditions, reproducing at each reuse or distribution the mention of this Creative Commons BY-NC-SA license.
Author(s)
Article outline
- 1. 植物生产与气候变化
- 2. 光合作用的最适温度
- 3. 二氧化碳同化是温度响应特征不同的诸过程相互作用的结果
- 4. C3和C4植物中,决定CO2同化最适温度的过程是什么?
- 5. C3光合途径的最适温度受某些环境因子的调控
- 6. 为什么无论温度较最适宜温度升或降,二氧化碳吸收速率总是降低的?
- 7. 植物的低温(≤10 °C左右)和高温(≥37°C左右)锻炼
- 8. 温度对光合作用的影响:总结图
- 9. 需要记住的信息
Learn more
The path of carbon in photosynthesis
04-03-2020
How is the carbon from carbon dioxide – CO2 – present in the atmosphere integrated…
Jean-François MOROT-GAUDRY , INRA Emeritus Research Director, the Jean-Pierre Bourgin Institute, INRA Versailles, Member of the Académie d’Agriculture.
Pressure, temperature and heat
05-02-2019
Pressure, temperature and heat are quantities used in everyday life, especially in meteorology. Their physical…
Joël SOMMERIA , CNRS Research Director, LEGI (Laboratoire des Écoulements Géophysiques et Industriels), Université Grenoble-Alpes.
The average temperature of the earth
29-07-2020
Global climate change is a major concern. It is based on the scientific community’s statement…
Serge PLANTON , General engineer of bridges, waters and forests, former climatologist researcher at Météo-France, CNRM (Centre National de Recherches Météorologiques).
|
|
高大的电影票 · ChristineB - 影视搜索 - 好看网 8 月前 |