|
PCP Archives Storage per Day
20 MB
120 MB
271 MB
pmlogger
Memory
104 MB
524 MB
1049 MB
pmlogger
Network per Day (In)
0.38 MB
1.75 MB
3.48 MB
pmproxy
Memory
2.67 GB
5.5GB
Redis Memory per Day
0.54 GB
2.65 GB
5.3 GB
The
pmproxy
queues Redis requests and employs Redis pipelining to speed up Redis queries. This can result in high memory usage. For troubleshooting this issue, see
Troubleshooting high memory usage
.
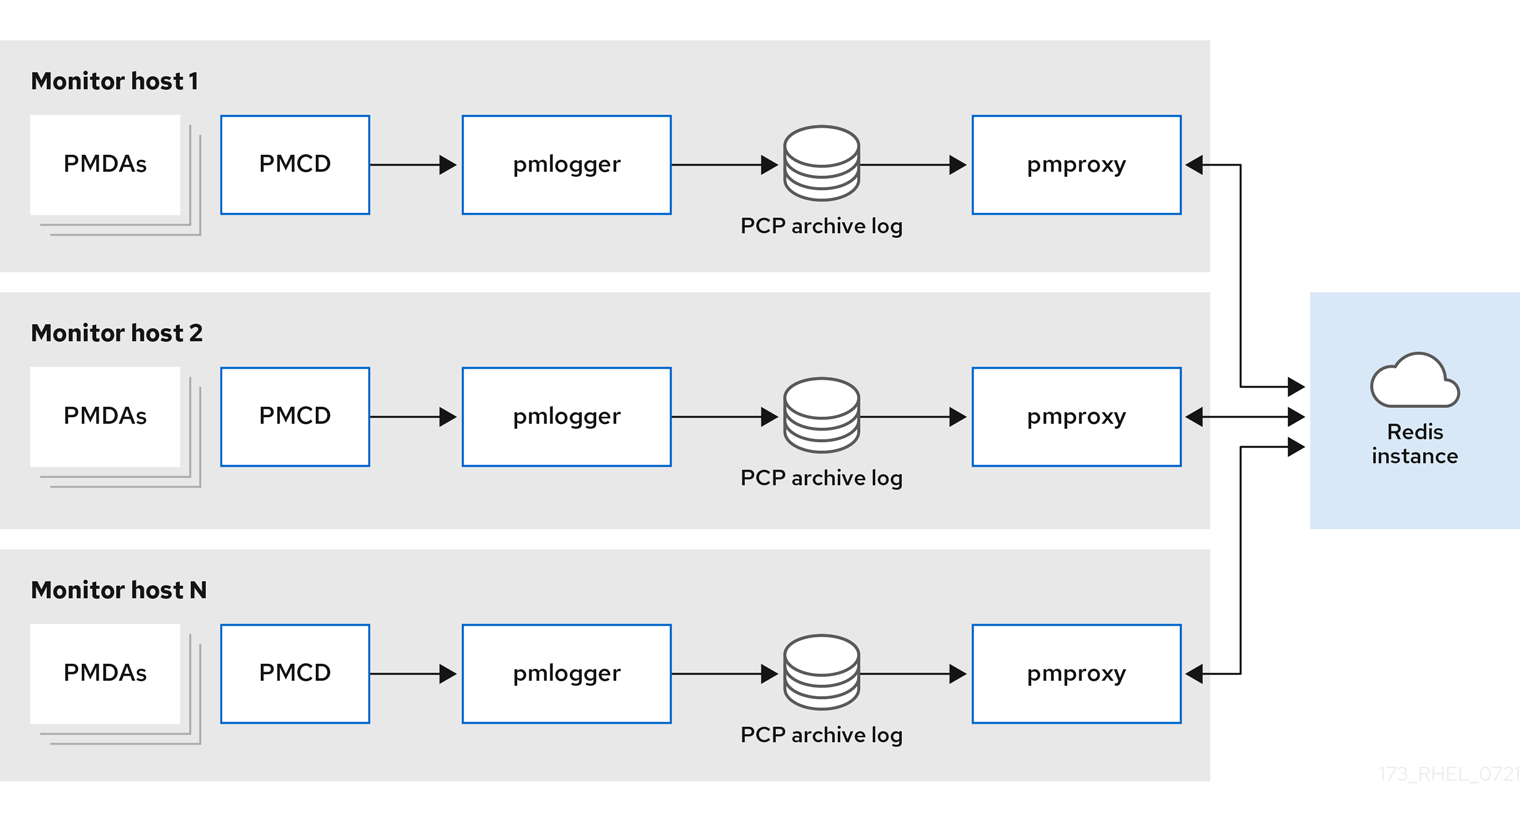
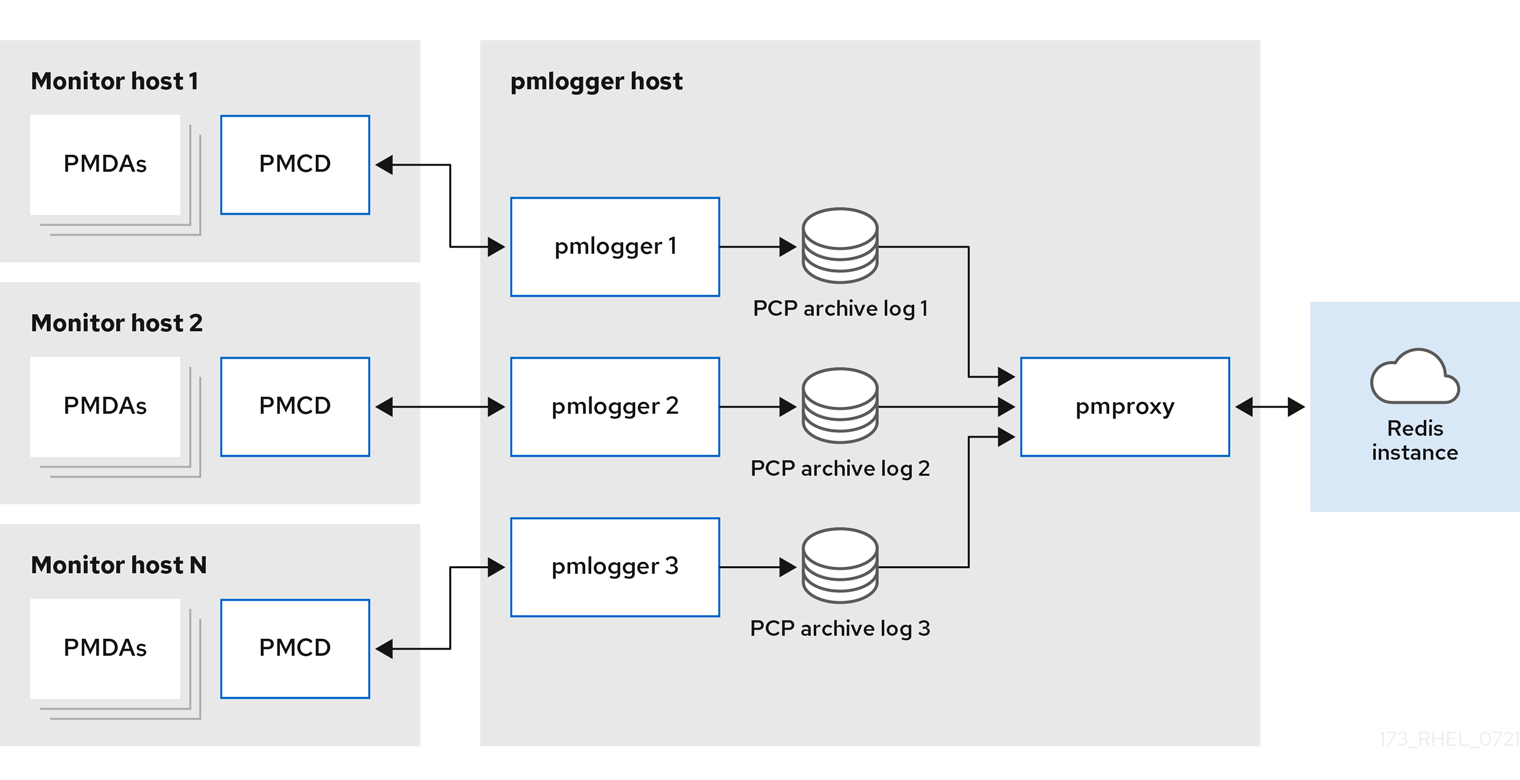
5.10. Example: Analyzing the federated setup deployment
The following results were observed on a federated setup, also known as multiple
pmlogger
farms, consisting of three centralized logging (
pmlogger
farm) setups, where each
pmlogger
farm was monitoring 100 remote hosts, that is 300 hosts in total.
This setup of the
pmlogger
farms is identical to the configuration mentioned in the
Example: Analyzing the centralized logging deployment
for 60s logging interval, except that the Redis servers were operating in cluster mode.
Table 5.4. Used resources depending on federated hosts for 60s logging interval
|
PCP Archives Storage per Day
|
pmlogger
Memory
|
Network per Day (In/Out)
|
pmproxy
Memory
|
Redis Memory per Day
|
|
277 MB
1058 MB
15.6 MB / 12.3 MB
6-8 GB
5.5 GB
Here, all values are per host. The network bandwidth is higher due to the inter-node communication of the Redis cluster.
5.11. Establishing secure PCP connections
You can configure PCP collector and monitoring components to participate in secure PCP protocol exchanges.
5.11.1. Secure PCP connections
You can establish secure connections between Performance Co-Pilot (PCP) collector and monitoring components. PCP collector components are the parts of PCP that collect and extract performance data from different sources. PCP monitor components are the parts of PCP that display data collected from hosts or archives that have the PCP collector components installed. Establishing secure connections between these components helps prevent unauthorized parties from accessing or modifying the data being collected and monitored.
All connections with the Performance Metrics Collector Daemon (
pmcd
) are made using the TCP/IP based PCP protocol. Protocol proxying and the PCP REST APIs are served by the
pmproxy
daemon - the REST API can be accessed over HTTPS, ensuring a secure connection.
Both the
pmcd
and
pmproxy
daemons are capable of simultaneous TLS and non-TLS communications on a single port. The default port for
pmcd
is 44321 and 44322 for
pmproxy
. This means that you do not have to choose between TLS or non-TLS communications for your PCP collector systems and can use both at the same time.
5.11.2. Configuring secure connections for PCP collector components
All PCP collector systems must have valid certificates in order to participate in secure PCP protocol exchanges.
the
pmproxy
daemon operates as both a client and a server from the perspective of TLS.
Prerequisites
-
PCP is installed. For more information, see
Installing and enabling PCP
.
The private client key is stored in the
/etc/pcp/tls/client.key
file. If you use a different path, adapt the corresponding steps of the procedure.
For details about creating a private key and certificate signing request (CSR), as well as how to request a certificate from a certificate authority (CA), see your CA’s documentation.
The TLS client certificate is stored in the
/etc/pcp/tls/client.crt
file. If you use a different path, adapt the corresponding steps of the procedure.
The CA certificate is stored in the
/etc/pcp/tls/ca.crt
file. If you use a different path, adapt the corresponding steps of the procedure. Additionally, for the
pmproxy
daemon:
The private server key is stored in the
/etc/pcp/tls/server.key
file. If you use a different path, adapt the corresponding steps of the procedure
The TLS server certificate is stored in the
/etc/pcp/tls/server.crt
file. If you use a different path, adapt the corresponding steps of the procedure.
Procedure
-
Update the PCP TLS configuration file on the collector systems to use the CA issued certificates to establish a secure connection:
# cat > /etc/pcp/tls.conf << END
tls-ca-cert-file = /etc/pcp/tls/ca.crt
tls-key-file = /etc/pcp/tls/server.key
tls-cert-file = /etc/pcp/tls/server.crt
tls-client-key-file = /etc/pcp/tls/client.key
tls-client-cert-file = /etc/pcp/tls/client.crt
							Restart the PCP collector infrastructure:
						# systemctl restart pmcd.service
# systemctl restart pmproxy.service
Verification
-
Verify the TLS configuration:
On the
pmcd
service:
# grep 'Info:' /var/log/pcp/pmcd/pmcd.log
[Tue Feb 07 11:47:33] pmcd(6558) Info: OpenSSL 3.0.7 setup
-
On the
pmproxy
service:
# grep 'Info:' /var/log/pcp/pmproxy/pmproxy.log
[Tue Feb 07 11:44:13] pmproxy(6014) Info: OpenSSL 3.0.7 setup
5.11.3. Configuring secure connections for PCP monitoring components
Configure your PCP monitoring components to participate in secure PCP protocol exchanges.
Prerequisites
-
PCP is installed. For more information, see
Installing and enabling PCP
.
The private client key is stored in the
~/.pcp/tls/client.key
file. If you use a different path, adapt the corresponding steps of the procedure.
For details about creating a private key and certificate signing request (CSR), as well as how to request a certificate from a certificate authority (CA), see your CA’s documentation.
The TLS client certificate is stored in the
~/.pcp/tls/client.crt
file. If you use a different path, adapt the corresponding steps of the procedure.
The CA certificate is stored in the
/etc/pcp/tls/ca.crt
file. If you use a different path, adapt the corresponding steps of the procedure.
Procedure
-
Create a TLS configuration file with the following information:
$ home=echo ~
$ cat > ~/.pcp/tls.conf << END
tls-ca-cert-file = /etc/pcp/tls/ca.crt
tls-key-file = $home/.pcp/tls/client.key
tls-cert-file = $home/.pcp/tls/client.crt
							Establish the secure connection:
						$ export PCP_SECURE_SOCKETS=enforce
$ export PCP_TLSCONF_PATH=~/.pcp/tls.conf
Verification
-
Verify the secure connection is configured:
$ pminfo --fetch --host pcps://localhost kernel.all.load
kernel.all.load
    inst [1 or "1 minute"] value 1.26
    inst [5 or "5 minute"] value 1.29
    inst [15 or "15 minute"] value 1.28
5.12. Troubleshooting high memory usage
The following scenarios can result in high memory usage:
The
pmproxy
process is busy processing new PCP archives and does not have spare CPU cycles to process Redis requests and responses.
The Redis node or cluster is overloaded and cannot process incoming requests on time.
The
pmproxy
service daemon uses Redis streams and supports the configuration parameters, which are PCP tuning parameters and affects Redis memory usage and key retention. The
/etc/pcp/pmproxy/pmproxy.conf
file lists the available configuration options for
pmproxy
and the associated APIs.
The following procedure describes how to troubleshoot high memory usage issue.
Prerequisites
-
Install the
pcp-pmda-redis
package:
# dnf install pcp-pmda-redis
-
Install the redis PMDA:
# cd /var/lib/pcp/pmdas/redis && ./Install
Procedure
-
To troubleshoot high memory usage, execute the following command and observe the
inflight
column:
$ pmrep :pmproxy
         backlog  inflight  reqs/s  resp/s   wait req err  resp err  changed  throttled
          byte     count   count/s  count/s  s/s  count/s   count/s  count/s   count/s
14:59:08   0         0       N/A       N/A   N/A    N/A      N/A      N/A        N/A
14:59:09   0         0    2268.9    2268.9    28     0        0       2.0        4.0
14:59:10   0         0       0.0       0.0     0     0        0       0.0        0.0
14:59:11   0         0       0.0       0.0     0     0        0       0.0        0.0
This column shows how many Redis requests are in-flight, which means they are queued or sent, and no reply was received so far.
A high number indicates one of the following conditions:
The
pmproxy
process is busy processing new PCP archives and does not have spare CPU cycles to process Redis requests and responses.
The Redis node or cluster is overloaded and cannot process incoming requests on time.
To troubleshoot the high memory usage issue, reduce the number of
pmlogger
processes for this farm, and add another pmlogger farm. Use the federated - multiple pmlogger farms setup.
If the Redis node is using 100% CPU for an extended amount of time, move it to a host with better performance or use a clustered Redis setup instead.
To view the
pmproxy.redis.*
metrics, use the following command:
$ pminfo -ftd pmproxy.redis
pmproxy.redis.responses.wait [wait time for responses]
    Data Type: 64-bit unsigned int  InDom: PM_INDOM_NULL 0xffffffff
    Semantics: counter  Units: microsec
    value 546028367374
pmproxy.redis.responses.error [number of error responses]
    Data Type: 64-bit unsigned int  InDom: PM_INDOM_NULL 0xffffffff
    Semantics: counter  Units: count
    value 1164
[...]
pmproxy.redis.requests.inflight.bytes [bytes allocated for inflight requests]
    Data Type: 64-bit int  InDom: PM_INDOM_NULL 0xffffffff
    Semantics: discrete  Units: byte
    value 0
pmproxy.redis.requests.inflight.total [inflight requests]
    Data Type: 64-bit unsigned int  InDom: PM_INDOM_NULL 0xffffffff
    Semantics: discrete  Units: count
    value 0
[...]
To view how many Redis requests are inflight, see the
pmproxy.redis.requests.inflight.total
metric and
pmproxy.redis.requests.inflight.bytes
metric to view how many bytes are occupied by all current inflight Redis requests.
In general, the redis request queue would be zero but can build up based on the usage of large pmlogger farms, which limits scalability and can cause high latency for
pmproxy
clients.
Use the
pminfo
command to view information about performance metrics. For example, to view the
redis.*
metrics, use the following command:
$ pminfo -ftd redis
redis.redis_build_id [Build ID]
    Data Type: string  InDom: 24.0 0x6000000
    Semantics: discrete  Units: count
    inst [0 or "localhost:6379"] value "87e335e57cffa755"
redis.total_commands_processed [Total number of commands processed by the server]
    Data Type: 64-bit unsigned int  InDom: 24.0 0x6000000
    Semantics: counter  Units: count
    inst [0 or "localhost:6379"] value 595627069
[...]
redis.used_memory_peak [Peak memory consumed by Redis (in bytes)]
    Data Type: 32-bit unsigned int  InDom: 24.0 0x6000000
    Semantics: instant  Units: count
    inst [0 or "localhost:6379"] value 572234920
[...]
To view the peak memory usage, see the
redis.used_memory_peak
metric.
Chapter 9. Setting up graphical representation of PCP metrics
Using a combination of
pcp
,
grafana
,
pcp redis
,
pcp bpftrace
, and
pcp vector
provides provides graphical representation of the live data or data collected by Performance Co-Pilot (PCP).
9.1. Setting up PCP with pcp-zeroconf
This procedure describes how to set up PCP on a system with the
pcp-zeroconf
package. Once the
pcp-zeroconf
package is installed, the system records the default set of metrics into archived files.
Verification steps
-
Ensure that the
pmlogger
service is active, and starts archiving the metrics:
# pcp | grep pmlogger
 pmlogger: primary logger: /var/log/pcp/pmlogger/localhost.localdomain/20200401.00.12
9.2. Setting up a grafana-server
Grafana generates graphs that are accessible from a browser. The
grafana-server
is a back-end server for the Grafana dashboard. It listens, by default, on all interfaces, and provides web services accessed through the web browser. The
grafana-pcp
plugin interacts with the
pmproxy
protocol in the backend.
This procedure describes how to set up a
grafana-server
.
Procedure
-
Install the following packages:
# dnf install grafana grafana-pcp
-
Restart and enable the following service:
# systemctl restart grafana-server
# systemctl enable grafana-server
-
Open the server’s firewall for network traffic to the Grafana service.
# firewall-cmd --permanent --add-service=grafana
success
# firewall-cmd --reload
success
Verification steps
-
Ensure that the
grafana-server
is listening and responding to requests:
# ss -ntlp | grep 3000
LISTEN  0  128  *:3000  *:*  users:(("grafana-server",pid=19522,fd=7))
-
Ensure that the
grafana-pcp
plugin is installed:
# grafana-cli plugins ls | grep performancecopilot-pcp-app
performancecopilot-pcp-app @ 3.1.0
Additional resources
-
pmproxy(1)
and
grafana-server
man pages
9.3. Accessing the Grafana web UI
This procedure describes how to access the Grafana web interface.
Using the Grafana web interface, you can:
add PCP Redis, PCP bpftrace, and PCP Vector data sources
create dashboard
view an overview of any useful metrics
create alerts in PCP Redis
Procedure
-
On the client system, open a browser and access the
grafana-server
on port
3000
, using
http://192.0.2.0
:3000 link.
Replace
192.0.2.0
with your machine IP.
For the first login, enter
admin
in both the
Email or username
and
Password
field.
Grafana prompts to set a
New password
to create a secured account. If you want to set it later, click
Skip
.
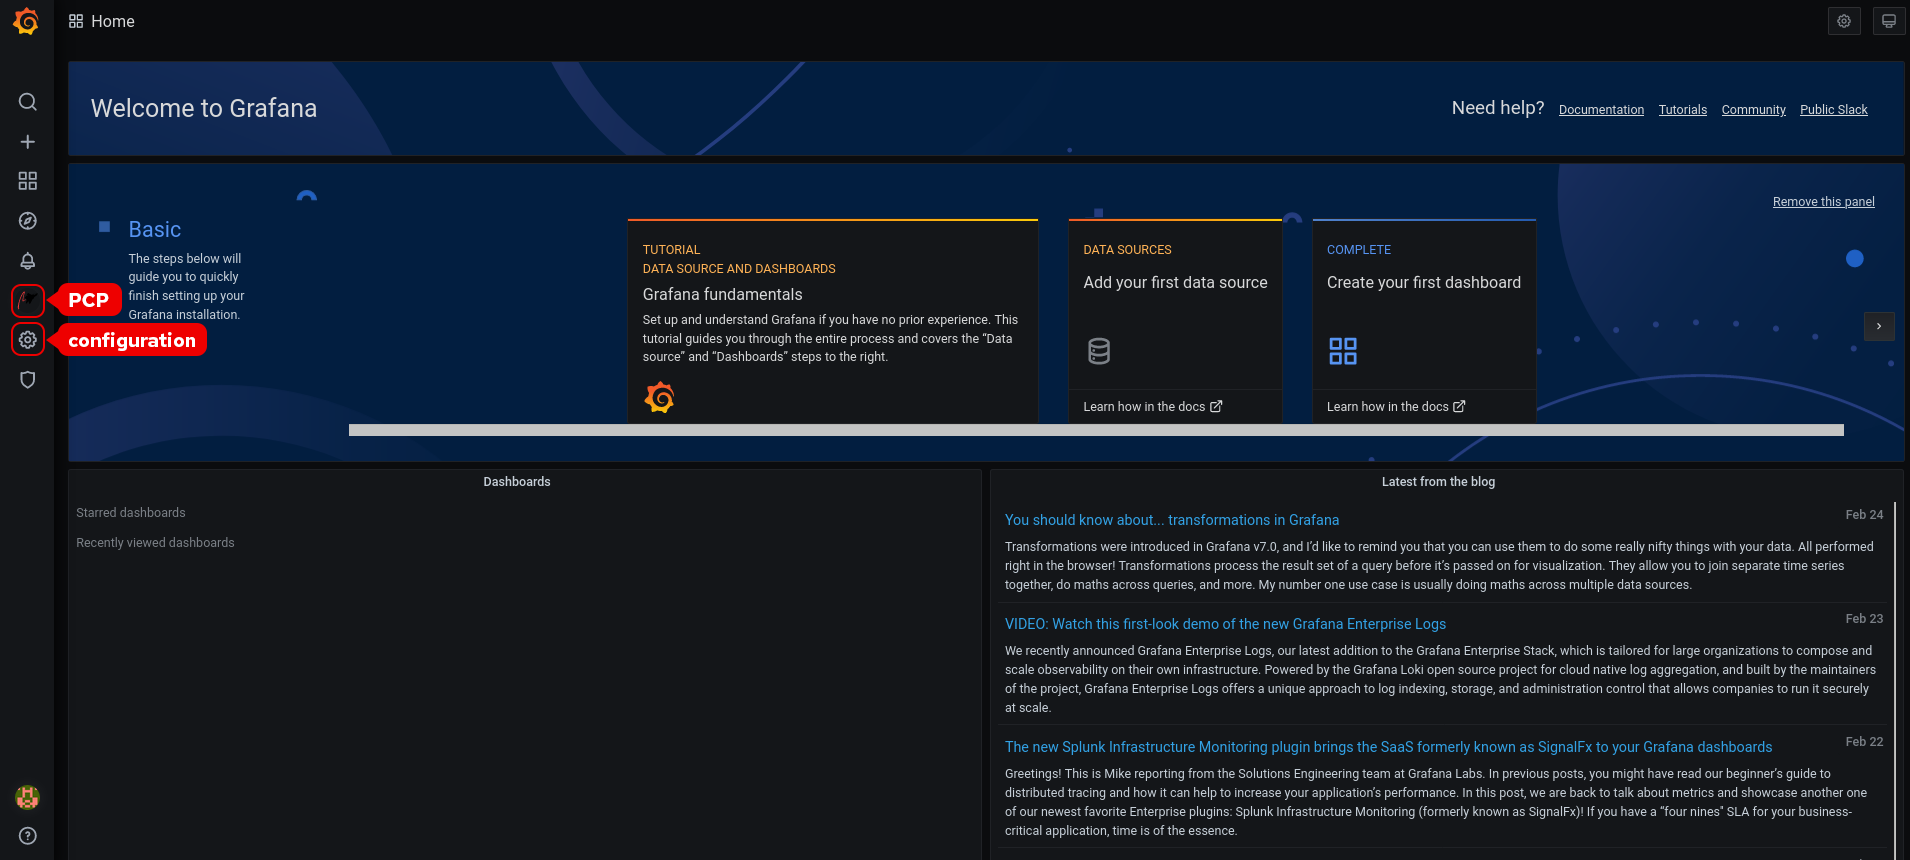
From the menu, hover over the
Configuration
icon and then click
Plugins
.
In the
Plugins
tab, type performance co-pilot in the
Search by name or type
text box and then click
Performance Co-Pilot
(PCP) plugin.
In the
Plugins / Performance Co-Pilot
pane, click
Enable
.
Click Grafana
icon. The Grafana
Home
page is displayed.
The top corner of the screen has a similar
icon, but it controls the general
Dashboard settings
.
In the Grafana
Home
page, click
Add your first data source
to add PCP Redis, PCP bpftrace, and PCP Vector data sources. For more information about adding data source, see:
To add pcp redis data source, view default dashboard, create a panel, and an alert rule, see
Creating panels and alert in PCP Redis data source
.
To add pcp bpftrace data source and view the default dashboard, see
Viewing the PCP bpftrace System Analysis dashboard
.
To add pcp vector data source, view the default dashboard, and to view the vector checklist, see
Viewing the PCP Vector Checklist
.
Optional: From the menu, hover over the
admin
profile
icon to change the
Preferences
including
Edit Profile
,
Change Password
, or to
Sign out
.
Additional resources
-
grafana-cli
and
grafana-server
man pages
9.4. Configuring secure connections for Grafana
You can establish secure connections between Grafana and Performance Co-Pilot (PCP) components. Establishing secure connections between these components helps prevent unauthorized parties from accessing or modifying the data being collected and monitored.
Prerequisites
-
PCP is installed. For more information, see
Installing and enabling PCP
.
The
grafana-server
is configured. For more information, see
Setting up a grafana-server
.
The private client key is stored in the
/etc/grafana/grafana.key
file. If you use a different path, modify the path in the corresponding steps of the procedure.
For details about creating a private key and certificate signing request (CSR), as well as how to request a certificate from a certificate authority (CA), see your CA’s documentation.
The TLS client certificate is stored in the
/etc/grafana/grafana.crt
file. If you use a different path, modify the path in the corresponding steps of the procedure.
Procedure
-
As a root user, open the
/etc/grafana/grana.ini
file and adjust the following options in the
[server]
section to reflect the following:
protocol = https
cert_key = /etc/grafana/grafana.key
cert_file = /etc/grafana/grafana.crt
-
Ensure grafana can access the certificates:
# su grafana -s /bin/bash -c \
  'ls -1 /etc/grafana/grafana.crt /etc/grafana/grafana.key'
/etc/grafana/grafana.crt
/etc/grafana/grafana.key
-
Restart and enable the Grafana service to apply the configuration changes:
# systemctl restart grafana-server
# systemctl enable grafana-server
Verification
-
On the client system, open a browser and access the
grafana-server
machine on port 3000, using the
https://192.0.2.0:3000
link. Replace 192.0.2.0 with your machine IP.
Confirm the
lock icon is displayed beside the address bar.
If the protocol is set to
http
and an HTTPS connection is attempted, you will receive a
ERR_SSL_PROTOCOL_ERROR
error. If the protocol is set to
https
and an HTTP connection is attempted, the Grafana server responds with a “Client sent an HTTP request to an HTTPS server” message.
9.5. Configuring PCP Redis
Use the PCP Redis data source to:
View data archives
Query time series using pmseries language
Analyze data across multiple hosts
Procedure
-
Install the
redis
package:
# dnf install redis
-
Start and enable the following services:
# systemctl start pmproxy redis
# systemctl enable pmproxy redis
-
Restart the
grafana-server
:
# systemctl restart grafana-server
Verification steps
-
Ensure that the
pmproxy
and
redis
are working:
# pmseries disk.dev.read
2eb3e58d8f1e231361fb15cf1aa26fe534b4d9df
This command does not return any data if the
redis
package is not installed.
9.6. Configuring secure connections for PCP redis
You can establish secure connections between performance co-pilot (PCP), Grafana, and PCP redis. Establishing secure connections between these components helps prevent unauthorized parties from accessing or modifying the data being collected and monitored.
Prerequisites
-
PCP is installed. For more information, see
Installing and enabling PCP
.
The
grafana-server
is configured. For more information, see
Setting up a grafana-server
.
PCP redis is installed. For more information, see
Configuring PCP Redis
.
The private client key is stored in the
/etc/redis/client.key
file. If you use a different path, modify the path in the corresponding steps of the procedure.
For details about creating a private key and certificate signing request (CSR), as well as how to request a certificate from a certificate authority (CA), see your CA’s documentation.
The TLS client certificate is stored in the
/etc/redis/client.crt
file. If you use a different path, modify the path in the corresponding steps of the procedure.
The TLS server key is stored in the
/etc/redis/redis.key
file. If you use a different path, modify the path in the corresponding steps of the procedure.
The TLS server certificate is stored in the
/etc/redis/redis.crt
file. If you use a different path, modify the path in the corresponding steps of the procedure.
The CA certificate is stored in the
/etc/redis/ca.crt
file. If you use a different path, modify the path in the corresponding steps of the procedure.
Additionally, for the
pmproxy
daemon:
The private server key is stored in the
/etc/pcp/tls/server.key
file. If you use a different path, modify the path in the corresponding steps of the procedure.
Procedure
-
As a root user, open the
/etc/redis/redis.conf
file and adjust the TLS/SSL options to reflect the following properties:
port 0
tls-port 6379
tls-cert-file /etc/redis/redis.crt
tls-key-file /etc/redis/redis.key
tls-client-key-file /etc/redis/client.key
tls-client-cert-file /etc/redis/client.crt
tls-ca-cert-file /etc/redis/ca.crt
-
Ensure
redis
can access the TLS certificates:
# su redis -s /bin/bash -c \
  'ls -1 /etc/redis/ca.crt /etc/redis/redis.key /etc/redis/redis.crt'
/etc/redis/ca.crt
/etc/redis/redis.crt
/etc/redis/redis.key
-
Restart the
redis
server to apply the configuration changes:
# systemctl restart redis
Verification
-
Confirm the TLS configuration works:
# redis-cli --tls --cert /etc/redis/client.crt \
    --key /etc/redis/client.key \
    --cacert /etc/redis/ca.crt <<< "PING"
						Unsuccessful TLS configuration might result in the following error message:
					Could not negotiate a TLS connection: Invalid CA Certificate File/Directory
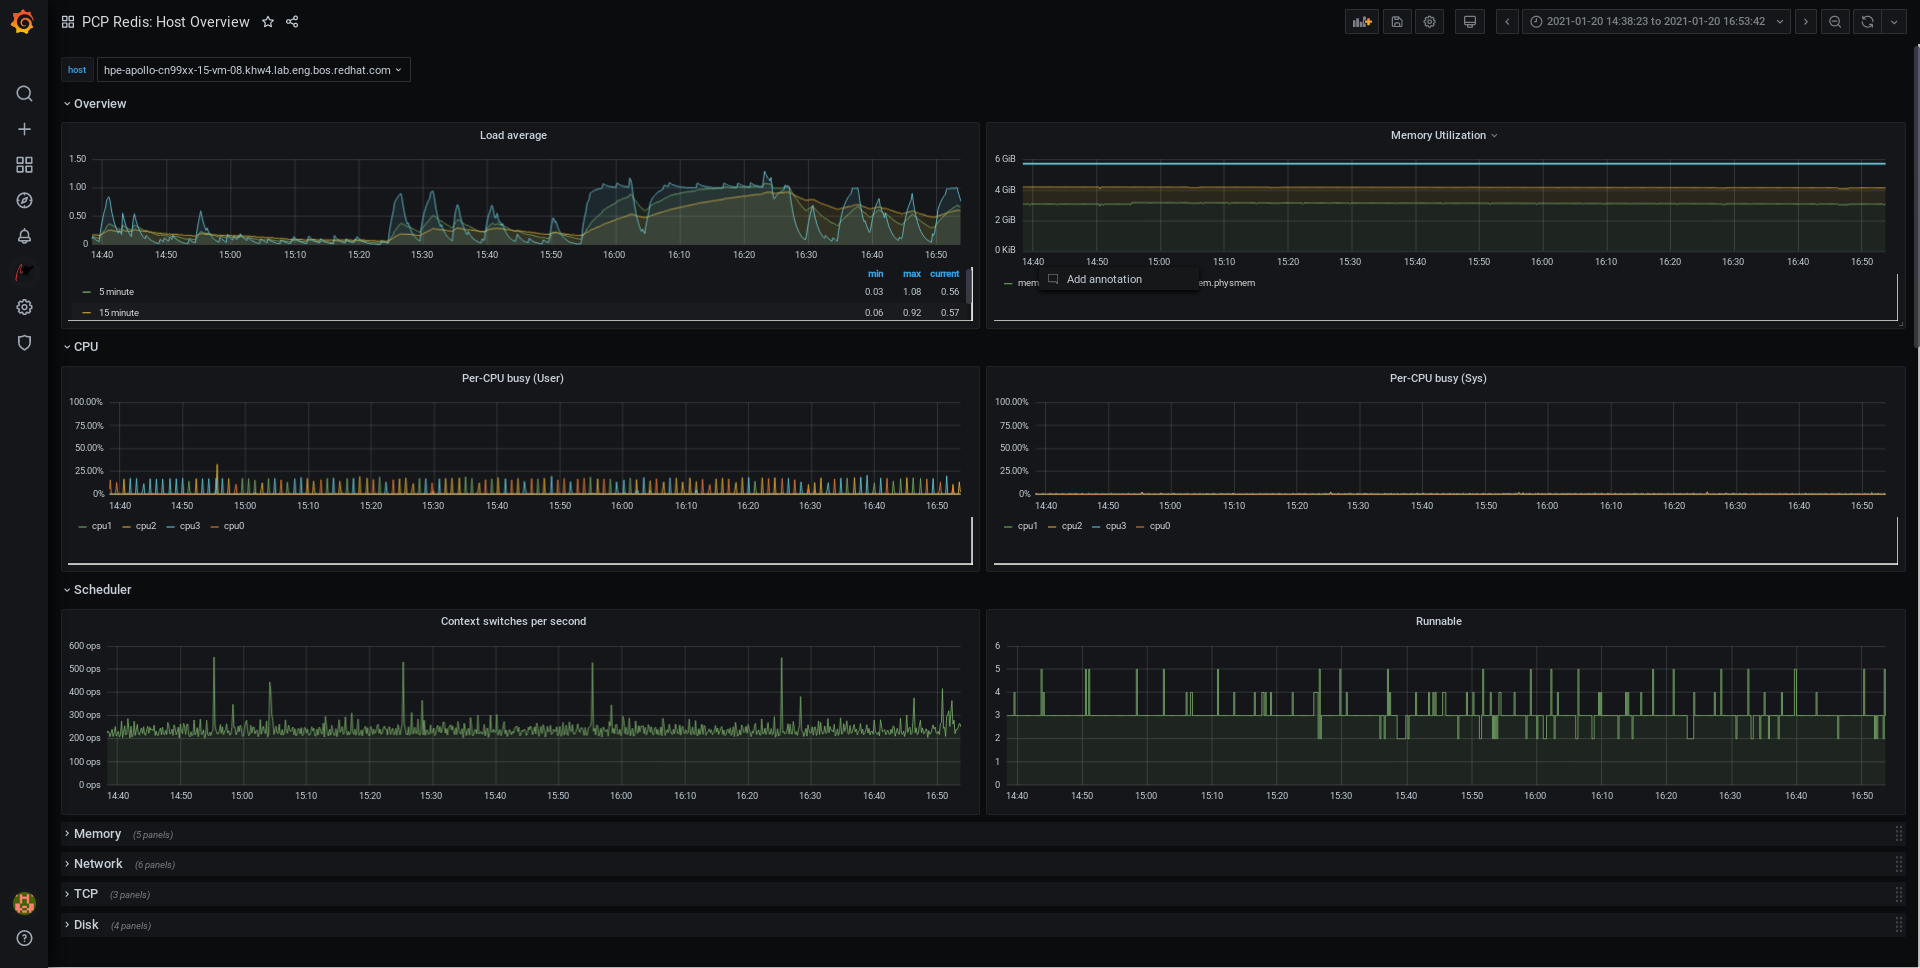
9.7. Creating panels and alert in PCP Redis data source
After adding the PCP Redis data source, you can view the dashboard with an overview of useful metrics, add a query to visualize the load graph, and create alerts that help you to view the system issues after they occur.
Procedure
-
Log into the Grafana web UI.
In the Grafana
Home
page, click
Add your first data source
.
In the
Add data source
pane, type redis in the
Filter by name or type
text box and then click
PCP Redis
.
In the
Data Sources / PCP Redis
pane, perform the following:
Add
http://localhost:44322
in the
URL
field and then click
Save & Test
.
Click
→
→
to see a dashboard with an overview of any useful metrics.
Add a new panel:
From the menu, hover over the
→
→
to add a panel.
In the
Query
tab, select the
PCP Redis
from the query list instead of the selected
default
option and in the text field of
A
, enter metric, for example,
kernel.all.load
to visualize the kernel load graph.
Optional: Add
Panel title
and
Description
, and update other options from the
Settings
.
Click
Save
to apply changes and save the dashboard. Add
Dashboard name
.
Click
Apply
to apply changes and go back to the dashboard.
Create an alert rule:
In the
PCP Redis query panel
, click
Alert
and then click
Create Alert
.
Edit the
Name
,
Evaluate query
, and
For
fields from the
Rule
, and specify the
Conditions
for your alert.
Click
Save
to apply changes and save the dashboard. Click
Apply
to apply changes and go back to the dashboard.
Optional: In the same panel, scroll down and click
Delete
icon to delete the created rule.
Optional: From the menu, click
Alerting
icon to view the created alert rules with different alert statuses, to edit the alert rule, or to pause the existing rule from the
Alert Rules
tab.
To add a notification channel for the created alert rule to receive an alert notification from Grafana, see
Adding notification channels for alerts
.
9.8. Adding notification channels for alerts
By adding notification channels, you can receive an alert notification from Grafana whenever the alert rule conditions are met and the system needs further monitoring.
You can receive these alerts after selecting any one type from the supported list of notifiers, which includes
DingDing
,
Discord
,
Email
,
Google Hangouts Chat
,
HipChat
,
Kafka REST Proxy
,
LINE
,
Microsoft Teams
,
OpsGenie
,
PagerDuty
,
Prometheus Alertmanager
,
Pushover
,
Sensu
,
Slack
,
Telegram
,
Threema Gateway
,
VictorOps
, and
webhook
.
Prerequisites
-
The
grafana-server
is accessible. For more information, see
Accessing the Grafana web UI
.
An alert rule is created. For more information, see
Creating panels and alert in PCP Redis data source
.
Configure SMTP and add a valid sender’s email address in the
grafana/grafana.ini
file:
# vi /etc/grafana/grafana.ini
[smtp]
enabled = true
from_address = abc@gmail.com
Replace
abc@gmail.com
by a valid email address.
Restart
grafana-server
# systemctl restart grafana-server.service
Procedure
-
From the menu, hover over the
→
→
.
In the
New contact point
details view, perform the following:
Enter your name in the
Name
text box
Select the
Contact point type
, for example, Email and enter the email address. You can add many email addresses by using the
;
separator.
Optional: Configure
Optional Email settings
and
Notification settings
.
Click
Save contact point
.
Select a notification channel in the alert rule:
From the menu, select
Notification policies
icon and then click
+ New specific policy
.
Choose the
Contact point
you have just created
Click the
Save policy
button
9.9. Setting up authentication between PCP components
You can setup authentication using the
scram-sha-256
authentication mechanism, which is supported by PCP through the Simple Authentication Security Layer (SASL) framework.
Procedure
-
Install the
sasl
framework for the
scram-sha-256
authentication mechanism:
# dnf install cyrus-sasl-scram cyrus-sasl-lib
-
Specify the supported authentication mechanism and the user database path in the
pmcd.conf
file:
# vi /etc/sasl2/pmcd.conf
mech_list: scram-sha-256
sasldb_path: /etc/pcp/passwd.db
-
Create a new user:
# useradd -r metrics
Replace
metrics
by your user name.
Add the created user in the user database:
# saslpasswd2 -a pmcd metrics
Password:
Again (for verification):
To add the created user, you are required to enter the
metrics
account password.
Set the permissions of the user database:
# chown root:pcp /etc/pcp/passwd.db
# chmod 640 /etc/pcp/passwd.db
-
Restart the
pmcd
service:
# systemctl restart pmcd
9.10. Installing PCP bpftrace
Install the PCP
bpftrace
agent to introspect a system and to gather metrics from the kernel and user-space tracepoints.
The
bpftrace
agent uses bpftrace scripts to gather the metrics. The
bpftrace
scripts use the enhanced Berkeley Packet Filter (
eBPF
).
This procedure describes how to install a
pcp bpftrace
.
Procedure
-
Install the
pcp-pmda-bpftrace
package:
# dnf install pcp-pmda-bpftrace
-
Edit the
bpftrace.conf
file and add the user that you have created in the {setting-up-authentication-between-pcp-components}:
# vi /var/lib/pcp/pmdas/bpftrace/bpftrace.conf
[dynamic_scripts]
enabled = true
auth_enabled = true
allowed_users = root,metrics
Replace
metrics
by your user name.
Install
bpftrace
PMDA:
# cd /var/lib/pcp/pmdas/bpftrace/
# ./Install
Updating the Performance Metrics Name Space (PMNS) ...
Terminate PMDA if already installed ...
Updating the PMCD control file, and notifying PMCD ...
Check bpftrace metrics have appeared ... 7 metrics and 6 values
The
pmda-bpftrace
is now installed, and can only be used after authenticating your user. For more information, see
Viewing the PCP bpftrace System Analysis dashboard
.
Additional resources
-
pmdabpftrace(1)
and
bpftrace
man pages
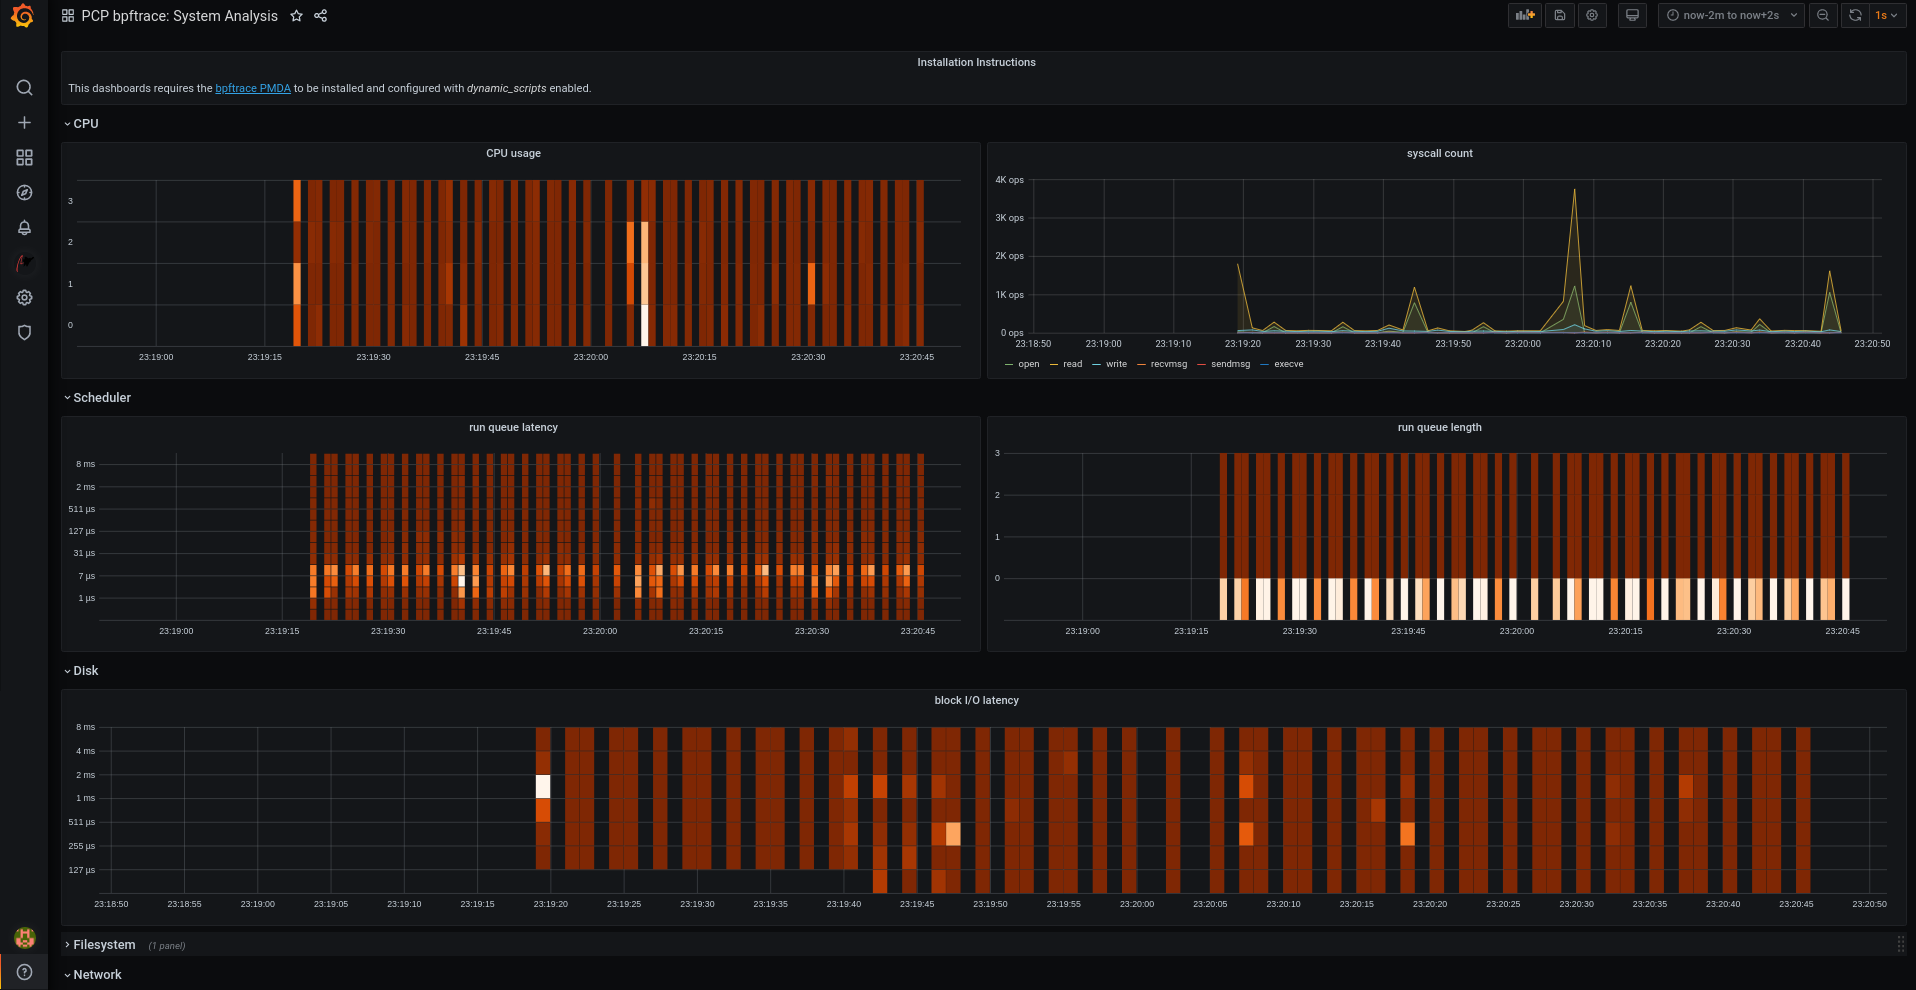
9.11. Viewing the PCP bpftrace System Analysis dashboard
Using the PCP bpftrace data source, you can access the live data from sources which are not available as normal data from the
pmlogger
or archives
In the PCP bpftrace data source, you can view the dashboard with an overview of useful metrics.
Procedure
-
Log into the Grafana web UI.
In the Grafana
Home
page, click
Add your first data source
.
In the
Add data source
pane, type bpftrace in the
Filter by name or type
text box and then click
PCP bpftrace
.
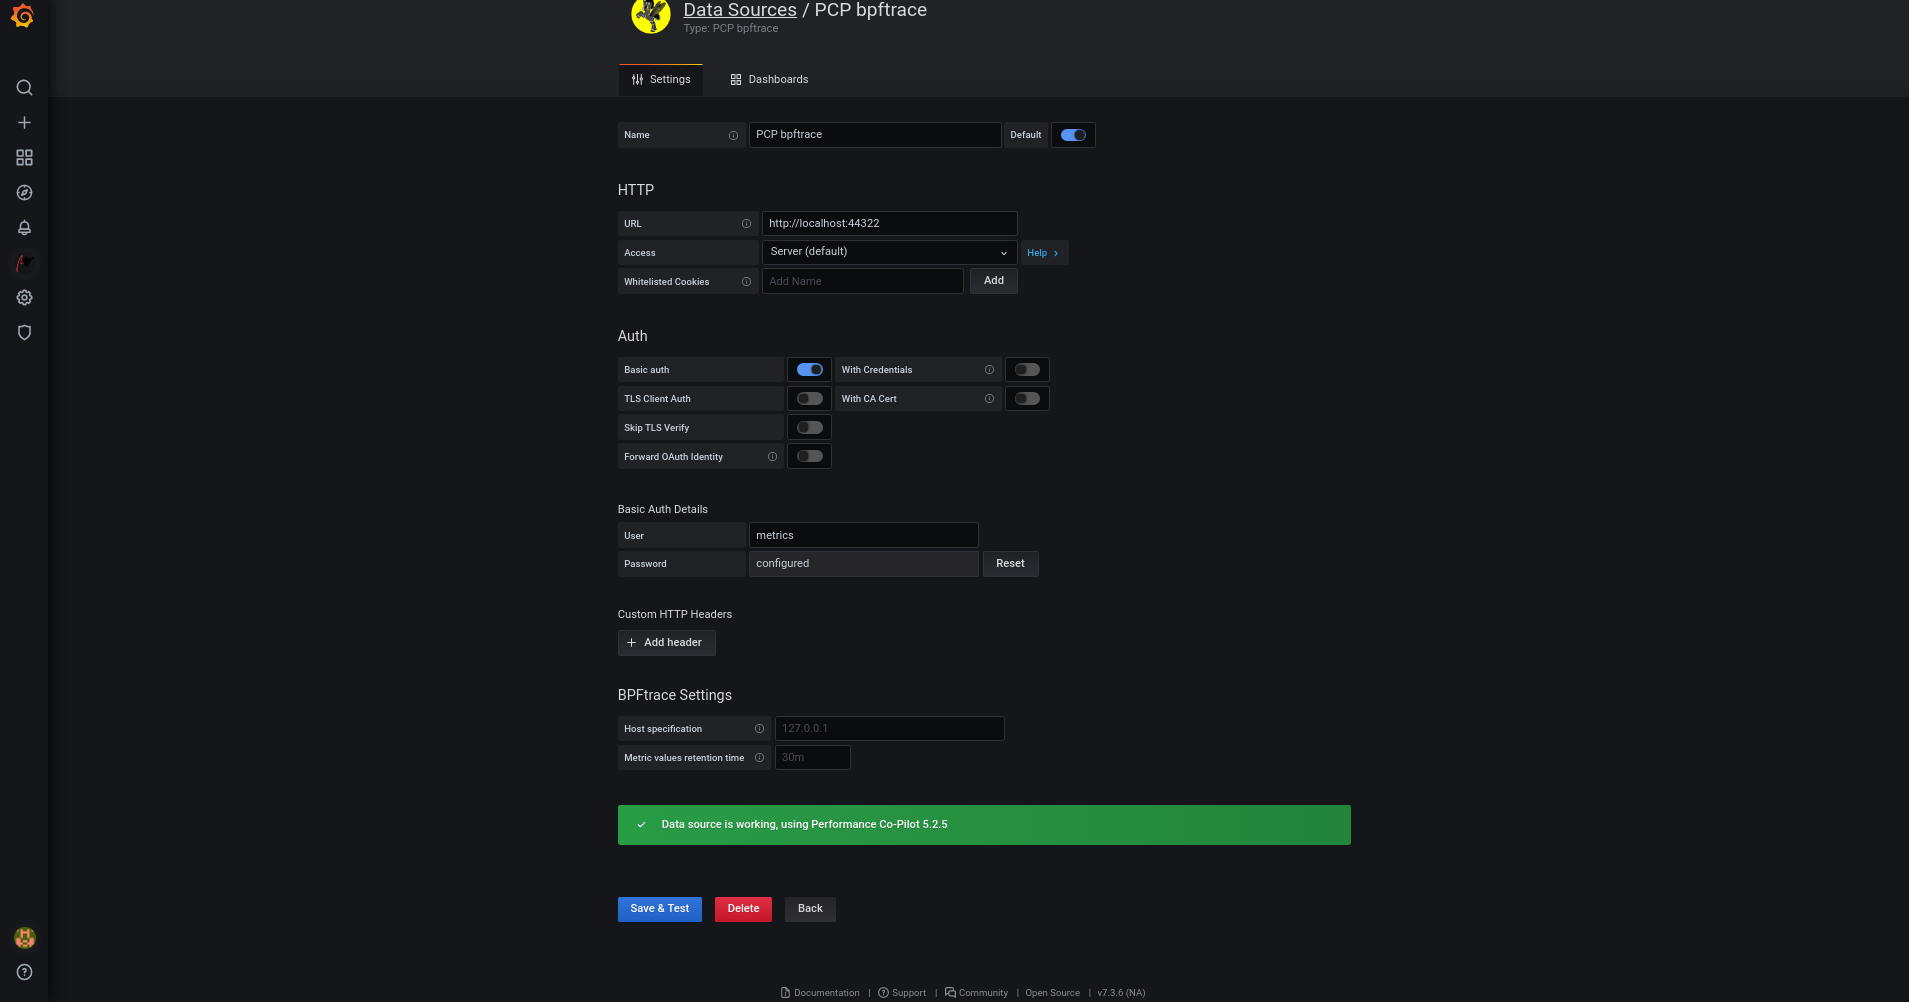
In the
Data Sources / PCP bpftrace
pane, perform the following:
Add
http://localhost:44322
in the
URL
field.
Toggle the
Basic Auth
option and add the created user credentials in the
User
and
Password
field.
Click
Save & Test
.
-
Click
→
→
to see a dashboard with an overview of any useful metrics.
9.12. Installing PCP Vector
This procedure describes how to install a
pcp vector
.
Procedure
-
Install the
pcp-pmda-bcc
package:
# dnf install pcp-pmda-bcc
-
Install the
bcc
PMDA:
# cd /var/lib/pcp/pmdas/bcc
# ./Install
[Wed Apr  1 00:27:48] pmdabcc(22341) Info: Initializing, currently in 'notready' state.
[Wed Apr  1 00:27:48] pmdabcc(22341) Info: Enabled modules:
[Wed Apr  1 00:27:48] pmdabcc(22341) Info: ['biolatency', 'sysfork',
[...]
Updating the Performance Metrics Name Space (PMNS) ...
Terminate PMDA if already installed ...
Updating the PMCD control file, and notifying PMCD ...
Check bcc metrics have appeared ... 1 warnings, 1 metrics and 0 values
9.13. Viewing the PCP Vector Checklist
The PCP Vector data source displays live metrics and uses the
pcp
metrics. It analyzes data for individual hosts.
After adding the PCP Vector data source, you can view the dashboard with an overview of useful metrics and view the related troubleshooting or reference links in the checklist.
Procedure
-
Log into the Grafana web UI.
In the Grafana
Home
page, click
Add your first data source
.
In the
Add data source
pane, type vector in the
Filter by name or type
text box and then click
PCP Vector
.
In the
Data Sources / PCP Vector
pane, perform the following:
Add
http://localhost:44322
in the
URL
field and then click
Save & Test
.
Click
→
→
to see a dashboard with an overview of any useful metrics.
From the menu, hover over the
Performance Co-Pilot
plugin and then click
PCP Vector Checklist
.
In the PCP checklist, click
help or
warning icon to view the related troubleshooting or reference links.
9.14. Using heatmaps in Grafana
You can use heatmaps in Grafana to view histograms of your data over time, identify trends and patterns in your data, and see how they change over time. Each column within a heatmap represents a single histogram with different colored cells representing the different densities of observation of a given value within that histogram.
This specific workflow is for the heatmaps in Grafana version 9.0.9 and later on RHEL9.
Procedure
-
Hover the cursor over the
Dashboards tab
and click
+ New dashboard
.
In the
Add panel
menu, click
Add a new panel
.
In the
Query
tab:
Select
PCP Redis
from the query list instead of the selected default option.
In the text field of
A
, enter a metric, for example,
kernel.all.load
to visualize the kernel load graph.
Click the visualization dropdown menu, which is set to
Time series
by default, and then click
Heatmap
.
Optional: In the
Panel Options
dropdown menu, add a
Panel Title
and
Description
.
In the
Heatmap
dropdown menu, under the
Calculate from data
setting, click
Yes
.
9.15. Troubleshooting Grafana issues
It is sometimes neccesary to troubleshoot Grafana issues, such as, Grafana does not display any data, the dashboard is black, or similar issues.
Procedure
-
Verify that the
pmlogger
service is up and running by executing the following command:
$ systemctl status pmlogger
-
Verify if files were created or modified to the disk by executing the following command:
$ ls /var/log/pcp/pmlogger/$(hostname)/ -rlt
total 4024
-rw-r--r--. 1 pcp pcp   45996 Oct 13  2019 20191013.20.07.meta.xz
-rw-r--r--. 1 pcp pcp     412 Oct 13  2019 20191013.20.07.index
-rw-r--r--. 1 pcp pcp   32188 Oct 13  2019 20191013.20.07.0.xz
-rw-r--r--. 1 pcp pcp   44756 Oct 13  2019 20191013.20.30-00.meta.xz
						Verify that the pmproxy service is running by executing the following command:
					$ systemctl status pmproxy
-
Verify that
pmproxy
is running, time series support is enabled, and a connection to Redis is established by viewing the
/var/log/pcp/pmproxy/pmproxy.log
file and ensure that it contains the following text:
pmproxy(1716) Info: Redis slots, command keys, schema version setup
Here,
1716
is the PID of pmproxy, which will be different for every invocation of
pmproxy
.
Verify if the Redis database contains any keys by executing the following command:
$ redis-cli dbsize
(integer) 34837
-
Verify if any PCP metrics are in the Redis database and
pmproxy
is able to access them by executing the following commands:
$ pmseries disk.dev.read
2eb3e58d8f1e231361fb15cf1aa26fe534b4d9df
$ pmseries "disk.dev.read[count:10]"
2eb3e58d8f1e231361fb15cf1aa26fe534b4d9df
    [Mon Jul 26 12:21:10.085468000 2021] 117971 70e83e88d4e1857a3a31605c6d1333755f2dd17c
    [Mon Jul 26 12:21:00.087401000 2021] 117758 70e83e88d4e1857a3a31605c6d1333755f2dd17c
    [Mon Jul 26 12:20:50.085738000 2021] 116688 70e83e88d4e1857a3a31605c6d1333755f2dd17c
[...]
$ redis-cli --scan --pattern "*$(pmseries 'disk.dev.read')"
pcp:metric.name:series:2eb3e58d8f1e231361fb15cf1aa26fe534b4d9df
pcp:values:series:2eb3e58d8f1e231361fb15cf1aa26fe534b4d9df
pcp:desc:series:2eb3e58d8f1e231361fb15cf1aa26fe534b4d9df
pcp:labelvalue:series:2eb3e58d8f1e231361fb15cf1aa26fe534b4d9df
pcp:instances:series:2eb3e58d8f1e231361fb15cf1aa26fe534b4d9df
pcp:labelflags:series:2eb3e58d8f1e231361fb15cf1aa26fe534b4d9df
-
Verify if there are any errors in the Grafana logs by executing the following command:
$ journalctl -e -u grafana-server
-- Logs begin at Mon 2021-07-26 11:55:10 IST, end at Mon 2021-07-26 12:30:15 IST. --
Jul 26 11:55:17 localhost.localdomain systemd[1]: Starting Grafana instance...
Jul 26 11:55:17 localhost.localdomain grafana-server[1171]: t=2021-07-26T11:55:17+0530 lvl=info msg="Starting Grafana" logger=server version=7.3.6 c>
Jul 26 11:55:17 localhost.localdomain grafana-server[1171]: t=2021-07-26T11:55:17+0530 lvl=info msg="Config loaded from" logger=settings file=/usr/s>
Jul 26 11:55:17 localhost.localdomain grafana-server[1171]: t=2021-07-26T11:55:17+0530 lvl=info msg="Config loaded from" logger=settings file=/etc/g>
[...]
|
|